Kubernetes 101
Be kind to the WiFi!
Don't use your hotspot.
Don't stream videos or download big files during the workshop.
Thank you!
Intros
Hello! We are:
✨ Laurent (@laurentgrangeau)
🌟 Ludovic (@lpiot)
The workshop will run from 9:30-12:30
There will be a break from 11:00-11:15
Feel free to interrupt for questions at any time
Especially when you see full screen container pictures!
A brief introduction
This was initially written by Jérôme Petazzoni to support in-person, instructor-led workshops and tutorials
Credit is also due to multiple contributors — thank you!
You can also follow along on your own, at your own pace
We included as much information as possible in these slides
We recommend having a mentor to help you ...
... Or be comfortable spending some time reading the Kubernetes documentation ...
... And looking for answers on StackOverflow and other outlets
About these slides
All the content is available in a public GitHub repository:
You can get updated "builds" of the slides there:
About these slides
All the content is available in a public GitHub repository:
You can get updated "builds" of the slides there:
- Typos? Mistakes? Questions? Feel free to hover over the bottom of the slide ...
👇 Try it! The source file will be shown and you can view it on GitHub and fork and edit it.
Extra details
This slide has a little magnifying glass in the top left corner
This magnifying glass indicates slides that provide extra details
Feel free to skip them if:
you are in a hurry
you are new to this and want to avoid cognitive overload
you want only the most essential information
You can review these slides another time if you want, they'll be waiting for you ☺
Chapter 1
(auto-generated TOC)
Chapter 2
(auto-generated TOC)
Chapter 3
(auto-generated TOC)
Chapter 4
(auto-generated TOC)

Pre-requirements
(automatically generated title slide)
Pre-requirements
Be comfortable with the UNIX command line
navigating directories
editing files
a little bit of bash-fu (environment variables, loops)
Some Docker knowledge
docker run,docker ps,docker buildideally, you know how to write a Dockerfile and build it
(even if it's aFROMline and a couple ofRUNcommands)
It's totally OK if you are not a Docker expert!
Tell me and I forget.
Teach me and I remember.
Involve me and I learn.
Misattributed to Benjamin Franklin
(Probably inspired by Chinese Confucian philosopher Xunzi)
Hands-on sections
The whole workshop is hands-on
We are going to build, ship, and run containers!
You are invited to reproduce all the demos
All hands-on sections are clearly identified, like the gray rectangle below
This is the stuff you're supposed to do!
Go to https://training.codeforcloud.tech/ to view these slides
Join the chat room: In person!
You get a cluster of cloud VMs
Each person gets a private cluster of cloud VMs (not shared with anybody else)
They'll remain up for the duration of the workshop
You should have a little card with login+password+IP addresses
You can automatically SSH from one VM to another
The nodes have aliases:
node1,node2, etc.
Why don't we run containers locally?
Installing that stuff can be hard on some machines
(32 bits CPU or OS... Laptops without administrator access... etc.)
"The whole team downloaded all these container images from the WiFi!
... and it went great!" (Literally no-one ever)All you need is a computer (or even a phone or tablet!), with:
an internet connection
a web browser
an SSH client
SSH clients
On Linux, OS X, FreeBSD... you are probably all set
On Windows, get one of these:
- putty
- Microsoft Win32 OpenSSH
- Git BASH
- MobaXterm
On Android, JuiceSSH (Play Store) works pretty well
Nice-to-have: Mosh instead of SSH, if your internet connection tends to lose packets
What is this Mosh thing?
You don't have to use Mosh or even know about it to follow along.
We're just telling you about it because some of us think it's cool!
Mosh is "the mobile shell"
It is essentially SSH over UDP, with roaming features
It retransmits packets quickly, so it works great even on lossy connections
(Like hotel or conference WiFi)
It has intelligent local echo, so it works great even in high-latency connections
(Like hotel or conference WiFi)
It supports transparent roaming when your client IP address changes
(Like when you hop from hotel to conference WiFi)
Using Mosh
To install it:
(apt|yum|brew) install moshIt has been pre-installed on the VMs that we are using
To connect to a remote machine:
mosh user@host(It is going to establish an SSH connection, then hand off to UDP)
It requires UDP ports to be open
(By default, it uses a UDP port between 60000 and 61000)
Connecting to our lab environment
- Log into the first VM (
node1) with your SSH client
- Check that you can SSH (without password) to
node2:ssh node2 - Type
exitor^Dto come back tonode1
If anything goes wrong — ask for help!
Doing or re-doing the workshop on your own?
Use something like Play-With-Docker or Play-With-Kubernetes
Zero setup effort; but environment are short-lived and might have limited resources
Create your own cluster (local or cloud VMs)
Small setup effort; small cost; flexible environments
Create a bunch of clusters for you and your friends (instructions)
Bigger setup effort; ideal for group training
We will (mostly) interact with node1 only
These remarks apply only when using multiple nodes, of course.
Unless instructed, all commands must be run from the first VM,
node1We will only checkout/copy the code on
node1During normal operations, we do not need access to the other nodes
If we had to troubleshoot issues, we would use a combination of:
SSH (to access system logs, daemon status...)
Docker API (to check running containers and container engine status)
Terminals
Once in a while, the instructions will say:
"Open a new terminal."
There are multiple ways to do this:
create a new window or tab on your machine, and SSH into the VM;
use screen or tmux on the VM and open a new window from there.
You are welcome to use the method that you feel the most comfortable with.
Tmux cheatsheet
Tmux is a terminal multiplexer like screen.
You don't have to use it or even know about it to follow along.
But some of us like to use it to switch between terminals.
It has been preinstalled on your workshop nodes.
- Ctrl-b c → creates a new window
- Ctrl-b n → go to next window
- Ctrl-b p → go to previous window
- Ctrl-b " → split window top/bottom
- Ctrl-b % → split window left/right
- Ctrl-b Alt-1 → rearrange windows in columns
- Ctrl-b Alt-2 → rearrange windows in rows
- Ctrl-b arrows → navigate to other windows
- Ctrl-b d → detach session
- tmux attach → reattach to session
Versions installed
- Kubernetes 1.13.0
- Docker Engine 18.09.0
- Docker Compose 1.21.1
- Check all installed versions:kubectl versiondocker versiondocker-compose -v
Kubernetes and Docker compatibility
- Kubernetes 1.13.x only validates Docker Engine versions up to 18.06
Kubernetes and Docker compatibility
- Kubernetes 1.13.x only validates Docker Engine versions up to 18.06
- Are we living dangerously?
Kubernetes and Docker compatibility
- Kubernetes 1.13.x only validates Docker Engine versions up to 18.06
- Are we living dangerously?
No!
"Validates" = continuous integration builds with very extensive (and expensive) testing
The Docker API is versioned, and offers strong backward-compatibility
(If a client uses e.g. API v1.25, the Docker Engine will keep behaving the same way)

Our sample application
(automatically generated title slide)
Our sample application
We will clone the GitHub repository onto our
node1The repository also contains scripts and tools that we will use through the workshop
- Clone the repository on
node1:git clone https://github.com/codeforcloud/container.training
(You can also fork the repository on GitHub and clone your fork if you prefer that.)
Downloading and running the application
Let's start this before we look around, as downloading will take a little time...
Go to the
dockercoinsdirectory, in the cloned repo:cd ~/container.training/dockercoinsUse Compose to build and run all containers:
docker-compose up
Compose tells Docker to build all container images (pulling the corresponding base images), then starts all containers, and displays aggregated logs.
What's this application?
What's this application?
- It is a DockerCoin miner! 💰🐳📦🚢
What's this application?
It is a DockerCoin miner! 💰🐳📦🚢
No, you can't buy coffee with DockerCoins
What's this application?
It is a DockerCoin miner! 💰🐳📦🚢
No, you can't buy coffee with DockerCoins
How DockerCoins works:
generate a few random bytes
hash these bytes
increment a counter (to keep track of speed)
repeat forever!
What's this application?
It is a DockerCoin miner! 💰🐳📦🚢
No, you can't buy coffee with DockerCoins
How DockerCoins works:
generate a few random bytes
hash these bytes
increment a counter (to keep track of speed)
repeat forever!
DockerCoins is not a cryptocurrency
(the only common points are "randomness", "hashing", and "coins" in the name)
DockerCoins in the microservices era
DockerCoins is made of 5 services:
rng= web service generating random byteshasher= web service computing hash of POSTed dataworker= background process callingrngandhasherwebui= web interface to watch progressredis= data store (holds a counter updated byworker)
These 5 services are visible in the application's Compose file, docker-compose.yml
How DockerCoins works
workerinvokes web servicerngto generate random bytesworkerinvokes web serviehasherto hash these bytesworkerdoes this in an infinite loopevery second,
workerupdatesredisto indicate how many loops were donewebuiqueriesredis, and computes and exposes "hashing speed" in our browser
(See diagram on next slide!)

Service discovery in container-land
How does each service find out the address of the other ones?
Service discovery in container-land
How does each service find out the address of the other ones?
We do not hard-code IP addresses in the code
We do not hard-code FQDN in the code, either
We just connect to a service name, and container-magic does the rest
(And by container-magic, we mean "a crafty, dynamic, embedded DNS server")
Example in worker/worker.py
redis = Redis("redis")def get_random_bytes(): r = requests.get("http://rng/32") return r.contentdef hash_bytes(data): r = requests.post("http://hasher/", data=data, headers={"Content-Type": "application/octet-stream"})(Full source code available here)
Links, naming, and service discovery
Containers can have network aliases (resolvable through DNS)
Compose file version 2+ makes each container reachable through its service name
Compose file version 1 did require "links" sections
Network aliases are automatically namespaced
you can have multiple apps declaring and using a service named
databasecontainers in the blue app will resolve
databaseto the IP of the blue databasecontainers in the green app will resolve
databaseto the IP of the green database
Show me the code!
You can check the GitHub repository with all the materials of this workshop:
https://github.com/codeforcloud/container.trainingThe application is in the dockercoins subdirectory
The Compose file (docker-compose.yml) lists all 5 services
redisis using an official image from the Docker Hubhasher,rng,worker,webuiare each built from a DockerfileEach service's Dockerfile and source code is in its own directory
(
hasheris in the hasher directory,rngis in the rng directory, etc.)
Compose file format version
This is relevant only if you have used Compose before 2016...
Compose 1.6 introduced support for a new Compose file format (aka "v2")
Services are no longer at the top level, but under a
servicessectionThere has to be a
versionkey at the top level, with value"2"(as a string, not an integer)Containers are placed on a dedicated network, making links unnecessary
There are other minor differences, but upgrade is easy and straightforward
Our application at work
On the left-hand side, the "rainbow strip" shows the container names
On the right-hand side, we see the output of our containers
We can see the
workerservice making requests torngandhasherFor
rngandhasher, we see HTTP access logs
Connecting to the web UI
"Logs are exciting and fun!" (No-one, ever)
The
webuicontainer exposes a web dashboard; let's view it
With a web browser, connect to
node1on port 8000Remember: the
nodeXaliases are valid only on the nodes themselvesIn your browser, you need to enter the IP address of your node
A drawing area should show up, and after a few seconds, a blue graph will appear.
Why does the speed seem irregular?
It looks like the speed is approximately 4 hashes/second
Or more precisely: 4 hashes/second, with regular dips down to zero
Why?
Why does the speed seem irregular?
It looks like the speed is approximately 4 hashes/second
Or more precisely: 4 hashes/second, with regular dips down to zero
Why?
The app actually has a constant, steady speed: 3.33 hashes/second
(which corresponds to 1 hash every 0.3 seconds, for reasons)Yes, and?
The reason why this graph is not awesome
The worker doesn't update the counter after every loop, but up to once per second
The speed is computed by the browser, checking the counter about once per second
Between two consecutive updates, the counter will increase either by 4, or by 0
The perceived speed will therefore be 4 - 4 - 4 - 0 - 4 - 4 - 0 etc.
What can we conclude from this?
- "I'm clearly incapable of writing good frontend code!" 😀 — Jérôme
Stopping the application
If we interrupt Compose (with
^C), it will politely ask the Docker Engine to stop the appThe Docker Engine will send a
TERMsignal to the containersIf the containers do not exit in a timely manner, the Engine sends a
KILLsignal
- Stop the application by hitting
^C
Stopping the application
If we interrupt Compose (with
^C), it will politely ask the Docker Engine to stop the appThe Docker Engine will send a
TERMsignal to the containersIf the containers do not exit in a timely manner, the Engine sends a
KILLsignal
- Stop the application by hitting
^C
Some containers exit immediately, others take longer.
The containers that do not handle SIGTERM end up being killed after a 10s timeout. If we are very impatient, we can hit ^C a second time!
Clean up
- Before moving on, let's remove those containers
- Tell Compose to remove everything:docker-compose down

Kubernetes concepts
(automatically generated title slide)
Kubernetes concepts
Kubernetes is a container management system
It runs and manages containerized applications on a cluster
Kubernetes concepts
Kubernetes is a container management system
It runs and manages containerized applications on a cluster
What does that really mean?
Basic things we can ask Kubernetes to do
Basic things we can ask Kubernetes to do
- Start 5 containers using image
atseashop/api:v1.3
Basic things we can ask Kubernetes to do
Start 5 containers using image
atseashop/api:v1.3Place an internal load balancer in front of these containers
Basic things we can ask Kubernetes to do
Start 5 containers using image
atseashop/api:v1.3Place an internal load balancer in front of these containers
Start 10 containers using image
atseashop/webfront:v1.3
Basic things we can ask Kubernetes to do
Start 5 containers using image
atseashop/api:v1.3Place an internal load balancer in front of these containers
Start 10 containers using image
atseashop/webfront:v1.3Place a public load balancer in front of these containers
Basic things we can ask Kubernetes to do
Start 5 containers using image
atseashop/api:v1.3Place an internal load balancer in front of these containers
Start 10 containers using image
atseashop/webfront:v1.3Place a public load balancer in front of these containers
It's Black Friday (or Christmas), traffic spikes, grow our cluster and add containers
New release! Replace my containers with the new image
atseashop/webfront:v1.4
Basic things we can ask Kubernetes to do
Start 5 containers using image
atseashop/api:v1.3Place an internal load balancer in front of these containers
Start 10 containers using image
atseashop/webfront:v1.3Place a public load balancer in front of these containers
It's Black Friday (or Christmas), traffic spikes, grow our cluster and add containers
New release! Replace my containers with the new image
atseashop/webfront:v1.4Keep processing requests during the upgrade; update my containers one at a time
Other things that Kubernetes can do for us
Basic autoscaling
Blue/green deployment, canary deployment
Long running services, but also batch (one-off) jobs
Overcommit our cluster and evict low-priority jobs
Run services with stateful data (databases etc.)
Fine-grained access control defining what can be done by whom on which resources
Integrating third party services (service catalog)
Automating complex tasks (operators)
Kubernetes architecture
Ha ha ha ha
OK, I was trying to scare you, it's much simpler than that ❤️
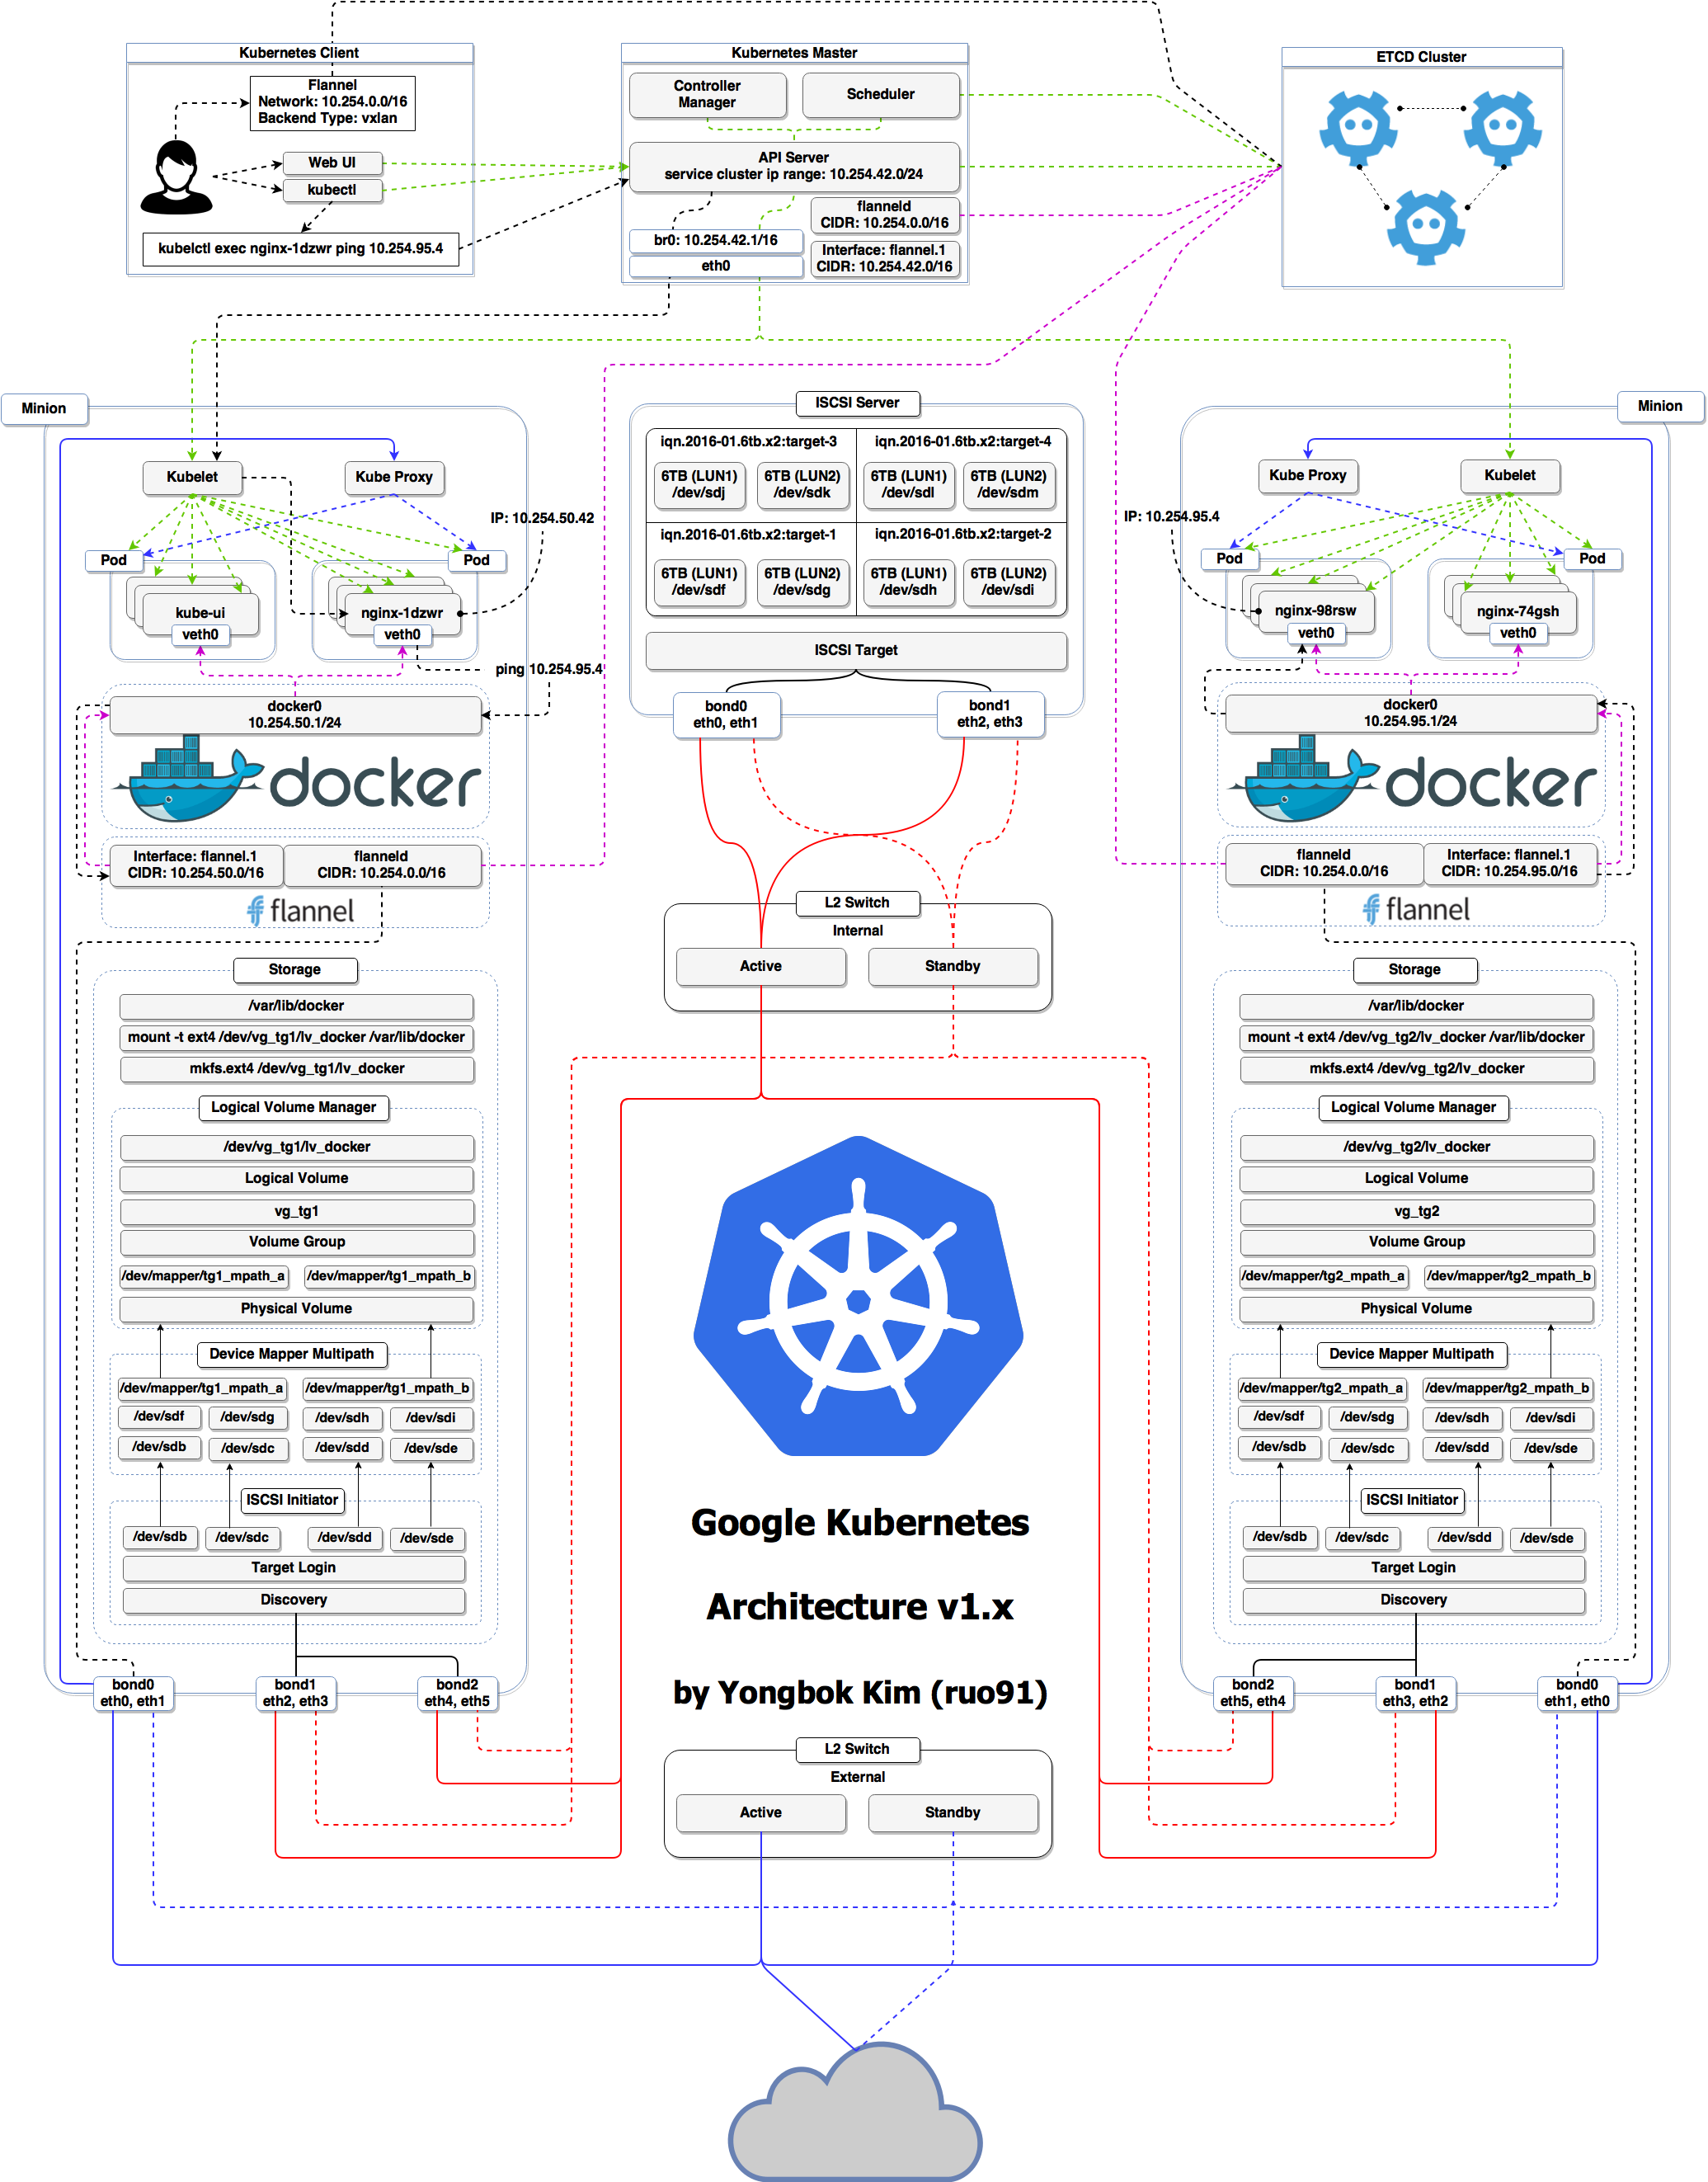
Credits
The first schema is a Kubernetes cluster with storage backed by multi-path iSCSI
(Courtesy of Yongbok Kim)
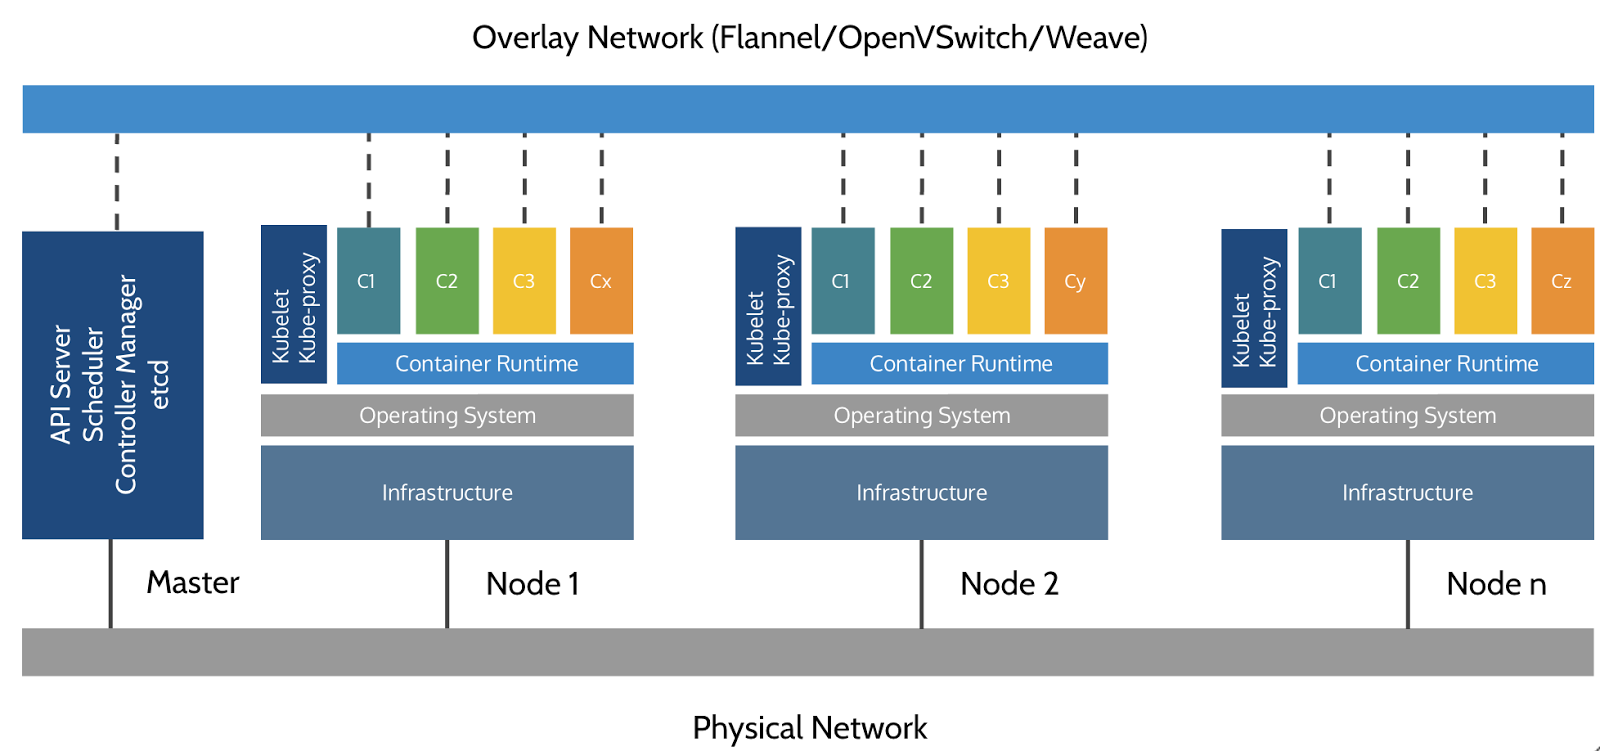
The second one is a simplified representation of a Kubernetes cluster
(Courtesy of Imesh Gunaratne)
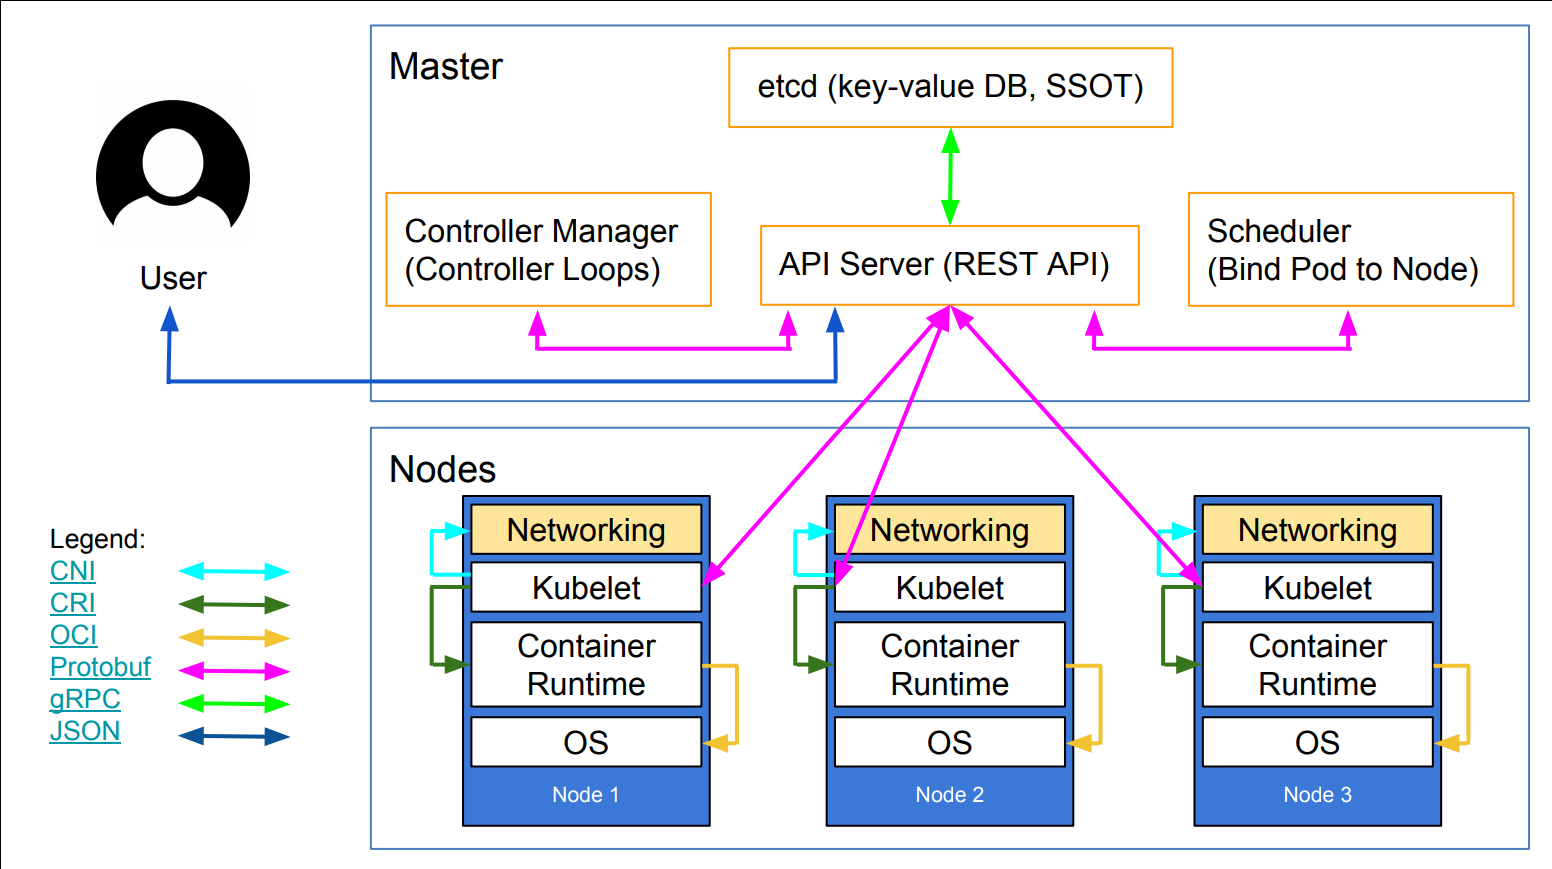
Kubernetes architecture: the nodes
The nodes executing our containers run a collection of services:
a container Engine (typically Docker)
kubelet (the "node agent")
kube-proxy (a necessary but not sufficient network component)
Nodes were formerly called "minions"
(You might see that word in older articles or documentation)
Kubernetes architecture: the control plane
The Kubernetes logic (its "brains") is a collection of services:
the API server (our point of entry to everything!)
core services like the scheduler and controller manager
etcd(a highly available key/value store; the "database" of Kubernetes)
Together, these services form the control plane of our cluster
The control plane is also called the "master"
Running the control plane on special nodes
It is common to reserve a dedicated node for the control plane
(Except for single-node development clusters, like when using minikube)
This node is then called a "master"
(Yes, this is ambiguous: is the "master" a node, or the whole control plane?)
Normal applications are restricted from running on this node
(By using a mechanism called "taints")
When high availability is required, each service of the control plane must be resilient
The control plane is then replicated on multiple nodes
(This is sometimes called a "multi-master" setup)
Running the control plane outside containers
The services of the control plane can run in or out of containers
For instance: since
etcdis a critical service, some people deploy it directly on a dedicated cluster (without containers)(This is illustrated on the first "super complicated" schema)
In some hosted Kubernetes offerings (e.g. AKS, GKE, EKS), the control plane is invisible
(We only "see" a Kubernetes API endpoint)
In that case, there is no "master node"
For this reason, it is more accurate to say "control plane" rather than "master".
Do we need to run Docker at all?
No!
Do we need to run Docker at all?
No!
By default, Kubernetes uses the Docker Engine to run containers
We could also use
rkt("Rocket") from CoreOSOr leverage other pluggable runtimes through the Container Runtime Interface
(like CRI-O, or containerd)
Do we need to run Docker at all?
Yes!
Do we need to run Docker at all?
Yes!
In this workshop, we run our app on a single node first
We will need to build images and ship them around
We can do these things without Docker
(and get diagnosed with NIH¹ syndrome)Docker is still the most stable container engine today
(but other options are maturing very quickly)
Do we need to run Docker at all?
On our development environments, CI pipelines ... :
Yes, almost certainly
On our production servers:
Yes (today)
Probably not (in the future)
More information about CRI on the Kubernetes blog
Kubernetes resources
The Kubernetes API defines a lot of objects called resources
These resources are organized by type, or
Kind(in the API)A few common resource types are:
- node (a machine — physical or virtual — in our cluster)
- pod (group of containers running together on a node)
- service (stable network endpoint to connect to one or multiple containers)
- namespace (more-or-less isolated group of things)
- secret (bundle of sensitive data to be passed to a container)
And much more!
We can see the full list by running
kubectl api-resources(In Kubernetes 1.10 and prior, the command to list API resources was
kubectl get)
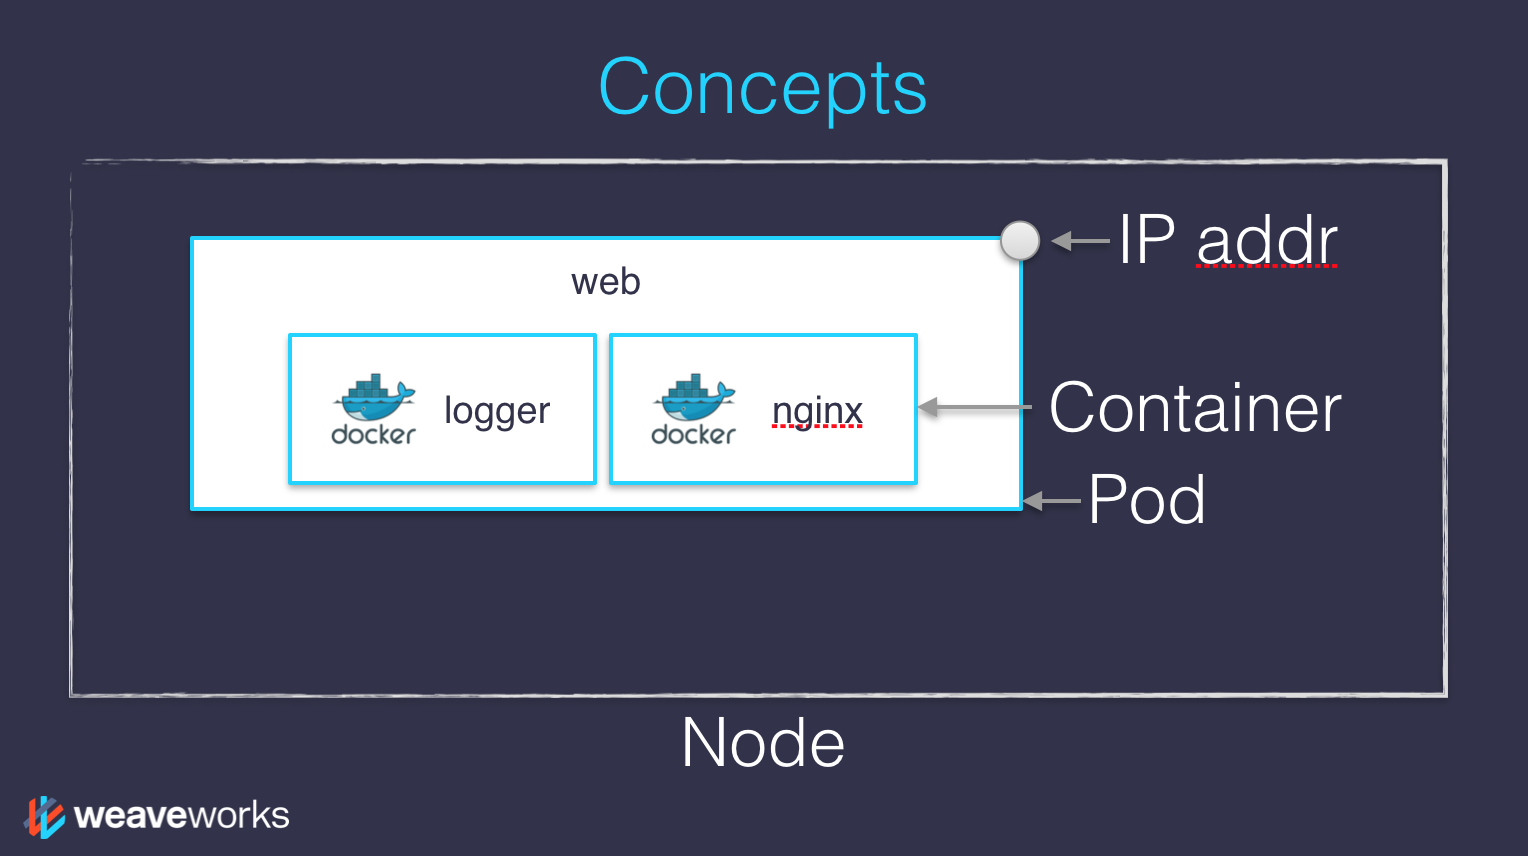
Credits
The first diagram is courtesy of Weave Works
a pod can have multiple containers working together
IP addresses are associated with pods, not with individual containers
The second diagram is courtesy of Lucas Käldström, in this presentation
- it's one of the best Kubernetes architecture diagrams available!
Both diagrams used with permission.

Declarative vs imperative
(automatically generated title slide)
Declarative vs imperative
Our container orchestrator puts a very strong emphasis on being declarative
Declarative:
I would like a cup of tea.
Imperative:
Boil some water. Pour it in a teapot. Add tea leaves. Steep for a while. Serve in a cup.
Declarative vs imperative
Our container orchestrator puts a very strong emphasis on being declarative
Declarative:
I would like a cup of tea.
Imperative:
Boil some water. Pour it in a teapot. Add tea leaves. Steep for a while. Serve in a cup.
Declarative seems simpler at first ...
Declarative vs imperative
Our container orchestrator puts a very strong emphasis on being declarative
Declarative:
I would like a cup of tea.
Imperative:
Boil some water. Pour it in a teapot. Add tea leaves. Steep for a while. Serve in a cup.
Declarative seems simpler at first ...
... As long as you know how to brew tea
Declarative vs imperative
What declarative would really be:
I want a cup of tea, obtained by pouring an infusion¹ of tea leaves in a cup.
Declarative vs imperative
What declarative would really be:
I want a cup of tea, obtained by pouring an infusion¹ of tea leaves in a cup.
¹An infusion is obtained by letting the object steep a few minutes in hot² water.
Declarative vs imperative
What declarative would really be:
I want a cup of tea, obtained by pouring an infusion¹ of tea leaves in a cup.
¹An infusion is obtained by letting the object steep a few minutes in hot² water.
²Hot liquid is obtained by pouring it in an appropriate container³ and setting it on a stove.
³Ah, finally, containers! Something we know about. Let's get to work, shall we?
Did you know there was an ISO standard specifying how to brew tea?
Declarative vs imperative
Imperative systems:
simpler
if a task is interrupted, we have to restart from scratch
Declarative systems:
if a task is interrupted (or if we show up to the party half-way through), we can figure out what's missing and do only what's necessary
we need to be able to observe the system
... and compute a "diff" between what we have and what we want
Declarative vs imperative in Kubernetes
Virtually everything we create in Kubernetes is created from a spec
Watch for the
specfields in the YAML files later!The spec describes how we want the thing to be
Kubernetes will reconcile the current state with the spec
(technically, this is done by a number of controllers)When we want to change some resource, we update the spec
Kubernetes will then converge that resource

Kubernetes network model
(automatically generated title slide)
Kubernetes network model
TL,DR:
Our cluster (nodes and pods) is one big flat IP network.
Kubernetes network model
TL,DR:
Our cluster (nodes and pods) is one big flat IP network.
In detail:
all nodes must be able to reach each other, without NAT
all pods must be able to reach each other, without NAT
pods and nodes must be able to reach each other, without NAT
each pod is aware of its IP address (no NAT)
Kubernetes doesn't mandate any particular implementation
Kubernetes network model: the good
Everything can reach everything
No address translation
No port translation
No new protocol
Pods cannot move from a node to another and keep their IP address
IP addresses don't have to be "portable" from a node to another
(We can use e.g. a subnet per node and use a simple routed topology)
The specification is simple enough to allow many various implementations
Kubernetes network model: the less good
Everything can reach everything
if you want security, you need to add network policies
the network implementation that you use needs to support them
There are literally dozens of implementations out there
(15 are listed in the Kubernetes documentation)
Pods have level 3 (IP) connectivity, but services are level 4
(Services map to a single UDP or TCP port; no port ranges or arbitrary IP packets)
kube-proxyis on the data path when connecting to a pod or container,
and it's not particularly fast (relies on userland proxying or iptables)
Kubernetes network model: in practice
The nodes that we are using have been set up to use Weave
We don't endorse Weave in a particular way, it just Works For Us
Don't worry about the warning about
kube-proxyperformanceUnless you:
- routinely saturate 10G network interfaces
- count packet rates in millions per second
- run high-traffic VOIP or gaming platforms
- do weird things that involve millions of simultaneous connections
(in which case you're already familiar with kernel tuning)
If necessary, there are alternatives to
kube-proxy; e.g.kube-router
The Container Network Interface (CNI)
The CNI has a well-defined specification for network plugins
When a pod is created, Kubernetes delegates the network setup to CNI plugins
Typically, a CNI plugin will:
allocate an IP address (by calling an IPAM plugin)
add a network interface into the pod's network namespace
configure the interface as well as required routes etc.
Using multiple plugins can be done with "meta-plugins" like CNI-Genie or Multus
Not all CNI plugins are equal
(e.g. they don't all implement network policies, which are required to isolate pods)

First contact with kubectl
(automatically generated title slide)
First contact with kubectl
kubectlis (almost) the only tool we'll need to talk to KubernetesIt is a rich CLI tool around the Kubernetes API
(Everything you can do with
kubectl, you can do directly with the API)On our machines, there is a
~/.kube/configfile with:the Kubernetes API address
the path to our TLS certificates used to authenticate
You can also use the
--kubeconfigflag to pass a config fileOr directly
--server,--user, etc.kubectlcan be pronounced "Cube C T L", "Cube cuttle", "Cube cuddle"...
kubectl get
- Let's look at our
Noderesources withkubectl get!
Look at the composition of our cluster:
kubectl get nodeThese commands are equivalent:
kubectl get nokubectl get nodekubectl get nodes
Obtaining machine-readable output
kubectl getcan output JSON, YAML, or be directly formatted
Give us more info about the nodes:
kubectl get nodes -o wideLet's have some YAML:
kubectl get no -o yamlSee that
kind: Listat the end? It's the type of our result!
(Ab)using kubectl and jq
- It's super easy to build custom reports
- Show the capacity of all our nodes as a stream of JSON objects:kubectl get nodes -o json |jq ".items[] | {name:.metadata.name} + .status.capacity"
What's available?
kubectlhas pretty good introspection facilitiesWe can list all available resource types by running
kubectl api-resources
(In Kubernetes 1.10 and prior, this command used to bekubectl get)We can view details about a resource with:
kubectl describe type/namekubectl describe type nameWe can view the definition for a resource type with:
kubectl explain type
Each time, type can be singular, plural, or abbreviated type name.
Services
A service is a stable endpoint to connect to "something"
(In the initial proposal, they were called "portals")
- List the services on our cluster with one of these commands:kubectl get serviceskubectl get svc
Services
A service is a stable endpoint to connect to "something"
(In the initial proposal, they were called "portals")
- List the services on our cluster with one of these commands:kubectl get serviceskubectl get svc
There is already one service on our cluster: the Kubernetes API itself.
ClusterIP services
A
ClusterIPservice is internal, available from the cluster onlyThis is useful for introspection from within containers
Try to connect to the API:
curl -k https://10.96.0.1-kis used to skip certificate verificationMake sure to replace 10.96.0.1 with the CLUSTER-IP shown by
kubectl get svc
The error that we see is expected: the Kubernetes API requires authentication.
Listing running containers
Containers are manipulated through pods
A pod is a group of containers:
running together (on the same node)
sharing resources (RAM, CPU; but also network, volumes)
- List pods on our cluster:kubectl get pods
Listing running containers
Containers are manipulated through pods
A pod is a group of containers:
running together (on the same node)
sharing resources (RAM, CPU; but also network, volumes)
- List pods on our cluster:kubectl get pods
These are not the pods you're looking for. But where are they?!?
Namespaces
- Namespaces allow us to segregate resources
- List the namespaces on our cluster with one of these commands:kubectl get namespaceskubectl get namespacekubectl get ns
Namespaces
- Namespaces allow us to segregate resources
- List the namespaces on our cluster with one of these commands:kubectl get namespaceskubectl get namespacekubectl get ns
You know what ... This kube-system thing looks suspicious.
Accessing namespaces
By default,
kubectluses thedefaultnamespaceWe can switch to a different namespace with the
-noption
- List the pods in the
kube-systemnamespace:kubectl -n kube-system get pods
Accessing namespaces
By default,
kubectluses thedefaultnamespaceWe can switch to a different namespace with the
-noption
- List the pods in the
kube-systemnamespace:kubectl -n kube-system get pods
Ding ding ding ding ding!
The kube-system namespace is used for the control plane.
What are all these control plane pods?
etcdis our etcd serverkube-apiserveris the API serverkube-controller-managerandkube-schedulerare other master componentscorednsprovides DNS-based service discovery (replacing kube-dns as of 1.11)kube-proxyis the (per-node) component managing port mappings and suchweaveis the (per-node) component managing the network overlaythe
READYcolumn indicates the number of containers in each podthe pods with a name ending with
-node1are the master components
(they have been specifically "pinned" to the master node)
What about kube-public?
- List the pods in the
kube-publicnamespace:kubectl -n kube-public get pods
What about kube-public?
- List the pods in the
kube-publicnamespace:kubectl -n kube-public get pods
- Maybe it doesn't have pods, but what secrets is
kube-publickeeping?
What about kube-public?
- List the pods in the
kube-publicnamespace:kubectl -n kube-public get pods
- Maybe it doesn't have pods, but what secrets is
kube-publickeeping?
- List the secrets in the
kube-publicnamespace:kubectl -n kube-public get secrets
What about kube-public?
- List the pods in the
kube-publicnamespace:kubectl -n kube-public get pods
- Maybe it doesn't have pods, but what secrets is
kube-publickeeping?
- List the secrets in the
kube-publicnamespace:kubectl -n kube-public get secrets
kube-publicis created by kubeadm & used for security bootstrapping

Setting up Kubernetes
(automatically generated title slide)
Setting up Kubernetes
- How did we set up these Kubernetes clusters that we're using?
Setting up Kubernetes
- How did we set up these Kubernetes clusters that we're using?
We used
kubeadmon freshly installed VM instances running Ubuntu 18.04 LTSInstall Docker
Install Kubernetes packages
Run
kubeadm initon the first node (it deploys the control plane on that node)Set up Weave (the overlay network)
(that step is just onekubectl applycommand; discussed later)Run
kubeadm joinon the other nodes (with the token produced bykubeadm init)Copy the configuration file generated by
kubeadm init
Check the prepare VMs README for more details
kubeadm drawbacks
Doesn't set up Docker or any other container engine
Doesn't set up the overlay network
Doesn't set up multi-master (no high availability)
kubeadm drawbacks
Doesn't set up Docker or any other container engine
Doesn't set up the overlay network
Doesn't set up multi-master (no high availability)
(At least ... not yet! Though it's experimental in 1.12.)
kubeadm drawbacks
Doesn't set up Docker or any other container engine
Doesn't set up the overlay network
Doesn't set up multi-master (no high availability)
(At least ... not yet! Though it's experimental in 1.12.)
"It's still twice as many steps as setting up a Swarm cluster 😕" -- Jérôme
Even more deployment options
If you like Ansible: kubespray
If you like Terraform: typhoon
If you like Terraform and Puppet: tarmak
You can also learn how to install every component manually, with the excellent tutorial Kubernetes The Hard Way
Kubernetes The Hard Way is optimized for learning, which means taking the long route to ensure you understand each task required to bootstrap a Kubernetes cluster.
There are also many commercial options available!
For a longer list, check the Kubernetes documentation:
it has a great guide to pick the right solution to set up Kubernetes.

Running our first containers on Kubernetes
(automatically generated title slide)
Running our first containers on Kubernetes
- First things first: we cannot run a container
Running our first containers on Kubernetes
First things first: we cannot run a container
We are going to run a pod, and in that pod there will be a single container
Running our first containers on Kubernetes
First things first: we cannot run a container
We are going to run a pod, and in that pod there will be a single container
In that container in the pod, we are going to run a simple
pingcommandThen we are going to start additional copies of the pod
Starting a simple pod with kubectl run
- We need to specify at least a name and the image we want to use
- Let's ping
1.1.1.1, Cloudflare's public DNS resolver:kubectl run pingpong --image alpine ping 1.1.1.1
Starting a simple pod with kubectl run
- We need to specify at least a name and the image we want to use
- Let's ping
1.1.1.1, Cloudflare's public DNS resolver:kubectl run pingpong --image alpine ping 1.1.1.1
(Starting with Kubernetes 1.12, we get a message telling us that
kubectl run is deprecated. Let's ignore it for now.)
Behind the scenes of kubectl run
- Let's look at the resources that were created by
kubectl run
- List most resource types:kubectl get all
Behind the scenes of kubectl run
- Let's look at the resources that were created by
kubectl run
- List most resource types:kubectl get all
We should see the following things:
deployment.apps/pingpong(the deployment that we just created)replicaset.apps/pingpong-xxxxxxxxxx(a replica set created by the deployment)pod/pingpong-xxxxxxxxxx-yyyyy(a pod created by the replica set)
Note: as of 1.10.1, resource types are displayed in more detail.
What are these different things?
A deployment is a high-level construct
allows scaling, rolling updates, rollbacks
multiple deployments can be used together to implement a canary deployment
delegates pods management to replica sets
A replica set is a low-level construct
makes sure that a given number of identical pods are running
allows scaling
rarely used directly
A replication controller is the (deprecated) predecessor of a replica set
Our pingpong deployment
kubectl runcreated a deployment,deployment.apps/pingpong
NAME DESIRED CURRENT UP-TO-DATE AVAILABLE AGEdeployment.apps/pingpong 1 1 1 1 10m- That deployment created a replica set,
replicaset.apps/pingpong-xxxxxxxxxx
NAME DESIRED CURRENT READY AGEreplicaset.apps/pingpong-7c8bbcd9bc 1 1 1 10m- That replica set created a pod,
pod/pingpong-xxxxxxxxxx-yyyyy
NAME READY STATUS RESTARTS AGEpod/pingpong-7c8bbcd9bc-6c9qz 1/1 Running 0 10mWe'll see later how these folks play together for:
- scaling, high availability, rolling updates
Viewing container output
Let's use the
kubectl logscommandWe will pass either a pod name, or a type/name
(E.g. if we specify a deployment or replica set, it will get the first pod in it)
Unless specified otherwise, it will only show logs of the first container in the pod
(Good thing there's only one in ours!)
- View the result of our
pingcommand:kubectl logs deploy/pingpong
Streaming logs in real time
Just like
docker logs,kubectl logssupports convenient options:-f/--followto stream logs in real time (à latail -f)--tailto indicate how many lines you want to see (from the end)--sinceto get logs only after a given timestamp
- View the latest logs of our
pingcommand:kubectl logs deploy/pingpong --tail 1 --follow
Scaling our application
- We can create additional copies of our container (I mean, our pod) with
kubectl scale
Scale our
pingpongdeployment:kubectl scale deploy/pingpong --replicas 8Note that this command does exactly the same thing:
kubectl scale deployment pingpong --replicas 8
Note: what if we tried to scale replicaset.apps/pingpong-xxxxxxxxxx?
We could! But the deployment would notice it right away, and scale back to the initial level.
Resilience
The deployment
pingpongwatches its replica setThe replica set ensures that the right number of pods are running
What happens if pods disappear?
- In a separate window, list pods, and keep watching them:kubectl get pods -w
- Destroy a pod:kubectl delete pod pingpong-xxxxxxxxxx-yyyyy
What if we wanted something different?
What if we wanted to start a "one-shot" container that doesn't get restarted?
We could use
kubectl run --restart=OnFailureorkubectl run --restart=NeverThese commands would create jobs or pods instead of deployments
Under the hood,
kubectl runinvokes "generators" to create resource descriptionsWe could also write these resource descriptions ourselves (typically in YAML),
and create them on the cluster withkubectl apply -f(discussed later)With
kubectl run --schedule=..., we can also create cronjobs
What about that deprecation warning?
As we can see from the previous slide,
kubectl runcan do many thingsThe exact type of resource created is not obvious
To make things more explicit, it is better to use
kubectl create:kubectl create deploymentto create a deploymentkubectl create jobto create a job
Eventually,
kubectl runwill be used only to start one-shot pods
Various ways of creating resources
kubectl run- easy way to get started
- versatile
kubectl create <resource>- explicit, but lacks some features
- can't create a CronJob
- can't pass command-line arguments to deployments
kubectl create -f foo.yamlorkubectl apply -f foo.yaml- all features are available
- requires writing YAML
Viewing logs of multiple pods
When we specify a deployment name, only one single pod's logs are shown
We can view the logs of multiple pods by specifying a selector
A selector is a logic expression using labels
Conveniently, when you
kubectl run somename, the associated objects have arun=somenamelabel
- View the last line of log from all pods with the
run=pingponglabel:kubectl logs -l run=pingpong --tail 1
Unfortunately, --follow cannot (yet) be used to stream the logs from multiple containers.
kubectl logs -l ... --tail N
If we run this with Kubernetes 1.12, the last command shows multiple lines
This is a regression when
--tailis used together with-l/--selectorIt always shows the last 10 lines of output for each container
(instead of the number of lines specified on the command line)
The problem was fixed in Kubernetes 1.13
See #70554 for details.
Aren't we flooding 1.1.1.1?
If you're wondering this, good question!
Don't worry, though:
APNIC's research group held the IP addresses 1.1.1.1 and 1.0.0.1. While the addresses were valid, so many people had entered them into various random systems that they were continuously overwhelmed by a flood of garbage traffic. APNIC wanted to study this garbage traffic but any time they'd tried to announce the IPs, the flood would overwhelm any conventional network.
It's very unlikely that our concerted pings manage to produce even a modest blip at Cloudflare's NOC!

Exposing containers
(automatically generated title slide)
Exposing containers
kubectl exposecreates a service for existing podsA service is a stable address for a pod (or a bunch of pods)
If we want to connect to our pod(s), we need to create a service
Once a service is created, CoreDNS will allow us to resolve it by name
(i.e. after creating service
hello, the namehellowill resolve to something)There are different types of services, detailed on the following slides:
ClusterIP,NodePort,LoadBalancer,ExternalName
Basic service types
ClusterIP(default type)- a virtual IP address is allocated for the service (in an internal, private range)
- this IP address is reachable only from within the cluster (nodes and pods)
- our code can connect to the service using the original port number
NodePort- a port is allocated for the service (by default, in the 30000-32768 range)
- that port is made available on all our nodes and anybody can connect to it
- our code must be changed to connect to that new port number
These service types are always available.
Under the hood: kube-proxy is using a userland proxy and a bunch of iptables rules.
More service types
LoadBalancer- an external load balancer is allocated for the service
- the load balancer is configured accordingly
(e.g.: aNodePortservice is created, and the load balancer sends traffic to that port) - available only when the underlying infrastructure provides some "load balancer as a service"
(e.g. AWS, Azure, GCE, OpenStack...)
ExternalName- the DNS entry managed by CoreDNS will just be a
CNAMEto a provided record - no port, no IP address, no nothing else is allocated
- the DNS entry managed by CoreDNS will just be a
Running containers with open ports
Since
pingdoesn't have anything to connect to, we'll have to run something elseWe could use the
nginxofficial image, but ...... we wouldn't be able to tell the backends from each other!
We are going to use
jpetazzo/httpenv, a tiny HTTP server written in Gojpetazzo/httpenvlistens on port 8888It serves its environment variables in JSON format
The environment variables will include
HOSTNAME, which will be the pod name(and therefore, will be different on each backend)
Creating a deployment for our HTTP server
We could do
kubectl run httpenv --image=jpetazzo/httpenv...But since
kubectl runis being deprecated, let's see how to usekubectl createinstead
- In another window, watch the pods (to see when they will be created):kubectl get pods -w
Create a deployment for this very lightweight HTTP server:
kubectl create deployment httpenv --image=jpetazzo/httpenvScale it to 10 replicas:
kubectl scale deployment httpenv --replicas=10
Exposing our deployment
- We'll create a default
ClusterIPservice
Expose the HTTP port of our server:
kubectl expose deployment httpenv --port 8888Look up which IP address was allocated:
kubectl get service
Services are layer 4 constructs
You can assign IP addresses to services, but they are still layer 4
(i.e. a service is not an IP address; it's an IP address + protocol + port)
This is caused by the current implementation of
kube-proxy(it relies on mechanisms that don't support layer 3)
As a result: you have to indicate the port number for your service
Running services with arbitrary port (or port ranges) requires hacks
(e.g. host networking mode)
Testing our service
- We will now send a few HTTP requests to our pods
- Let's obtain the IP address that was allocated for our service, programmatically:IP=$(kubectl get svc httpenv -o go-template --template '{{ .spec.clusterIP }}')
Send a few requests:
curl http://$IP:8888/Too much output? Filter it with
jq:curl -s http://$IP:8888/ | jq .HOSTNAME
Try it a few times! Our requests are load balanced across multiple pods.
If we don't need a load balancer
Sometimes, we want to access our scaled services directly:
if we want to save a tiny little bit of latency (typically less than 1ms)
if we need to connect over arbitrary ports (instead of a few fixed ones)
if we need to communicate over another protocol than UDP or TCP
if we want to decide how to balance the requests client-side
...
In that case, we can use a "headless service"
Headless services
A headless service is obtained by setting the
clusterIPfield toNone(Either with
--cluster-ip=None, or by providing a custom YAML)As a result, the service doesn't have a virtual IP address
Since there is no virtual IP address, there is no load balancer either
CoreDNS will return the pods' IP addresses as multiple
ArecordsThis gives us an easy way to discover all the replicas for a deployment
Services and endpoints
A service has a number of "endpoints"
Each endpoint is a host + port where the service is available
The endpoints are maintained and updated automatically by Kubernetes
- Check the endpoints that Kubernetes has associated with our
httpenvservice:kubectl describe service httpenv
In the output, there will be a line starting with Endpoints:.
That line will list a bunch of addresses in host:port format.
Viewing endpoint details
When we have many endpoints, our display commands truncate the list
kubectl get endpointsIf we want to see the full list, we can use one of the following commands:
kubectl describe endpoints httpenvkubectl get endpoints httpenv -o yamlThese commands will show us a list of IP addresses
These IP addresses should match the addresses of the corresponding pods:
kubectl get pods -l app=httpenv -o wide
endpoints not endpoint
endpointsis the only resource that cannot be singular
$ kubectl get endpointerror: the server doesn't have a resource type "endpoint"This is because the type itself is plural (unlike every other resource)
There is no
endpointobject:type Endpoints structThe type doesn't represent a single endpoint, but a list of endpoints

Shipping images with a registry
(automatically generated title slide)
Shipping images with a registry
Initially, our app was running on a single node
We could build and run in the same place
Therefore, we did not need to ship anything
Now that we want to run on a cluster, things are different
The easiest way to ship container images is to use a registry
How Docker registries work (a reminder)
What happens when we execute
docker run alpine?If the Engine needs to pull the
alpineimage, it expands it intolibrary/alpinelibrary/alpineis expanded intoindex.docker.io/library/alpineThe Engine communicates with
index.docker.ioto retrievelibrary/alpine:latestTo use something else than
index.docker.io, we specify it in the image nameExamples:
docker pull gcr.io/google-containers/alpine-with-bash:1.0docker build -t registry.mycompany.io:5000/myimage:awesome .docker push registry.mycompany.io:5000/myimage:awesome
The plan
We are going to:
build images for our app,
ship these images with a registry,
run deployments using these images,
expose (with a ClusterIP) the deployments that need to communicate together,
expose (with a NodePort) the web UI so we can access it from outside.
Building and shipping our app
We will pick a registry
(let's pretend the address will be
REGISTRY:PORT)We will build on our control node (
node1)(the images will be named
REGISTRY:PORT/servicename)We will push the images to the registry
These images will be usable by the other nodes of the cluster
(i.e., we could do
docker run REGISTRY:PORT/servicenamefrom these nodes)
A shortcut opportunity
As it happens, the images that we need do already exist on the Docker Hub:
We could use them instead of using our own registry and images
In the following slides, we are going to show how to run a registry and use it to host container images. We will also show you how to use the existing images from the Docker Hub, so that you can catch up (or skip altogether the build/push part) if needed.
Which registry do we want to use?
We could use the Docker Hub
There are alternatives like Quay
Each major cloud provider has an option as well
(ACR on Azure, ECR on AWS, GCR on Google Cloud...)
There are also commercial products to run our own registry
(Docker EE, Quay...)
And open source options, too!
We are going to self-host an open source registry because it's the most generic solution for this workshop. We will use Docker's reference implementation for simplicity.
Using the open source registry
We need to run a
registrycontainerIt will store images and layers to the local filesystem
(but you can add a config file to use S3, Swift, etc.)Docker requires TLS when communicating with the registry
unless for registries on
127.0.0.0/8(i.e.localhost)or with the Engine flag
--insecure-registry
Our strategy: publish the registry container on a NodePort,
so that it's available through127.0.0.1:xxxxxon each node
Deploying a self-hosted registry
- We will deploy a registry container, and expose it with a NodePort
Create the registry service:
kubectl create deployment registry --image=registryExpose it on a NodePort:
kubectl expose deploy/registry --port=5000 --type=NodePort
Connecting to our registry
- We need to find out which port has been allocated
View the service details:
kubectl describe svc/registryGet the port number programmatically:
NODEPORT=$(kubectl get svc/registry -o json | jq .spec.ports[0].nodePort)REGISTRY=127.0.0.1:$NODEPORT
Testing our registry
- A convenient Docker registry API route to remember is
/v2/_catalog
- View the repositories currently held in our registry:curl $REGISTRY/v2/_catalog
Testing our registry
- A convenient Docker registry API route to remember is
/v2/_catalog
- View the repositories currently held in our registry:curl $REGISTRY/v2/_catalog
We should see:
{"repositories":[]}Testing our local registry
- We can retag a small image, and push it to the registry
Make sure we have the busybox image, and retag it:
docker pull busyboxdocker tag busybox $REGISTRY/busyboxPush it:
docker push $REGISTRY/busybox
Checking again what's on our local registry
- Let's use the same endpoint as before
- Ensure that our busybox image is now in the local registry:curl $REGISTRY/v2/_catalog
The curl command should now output:
{"repositories":["busybox"]}Building and pushing our images
- We are going to use a convenient feature of Docker Compose
Go to the
stacksdirectory:cd ~/container.training/stacksBuild and push the images:
export REGISTRYexport TAG=v0.1docker-compose -f dockercoins.yml builddocker-compose -f dockercoins.yml push
Let's have a look at the dockercoins.yml file while this is building and pushing.
version: "3"services: rng: build: dockercoins/rng image: ${REGISTRY-127.0.0.1:5000}/rng:${TAG-latest} deploy: mode: global ... redis: image: redis ... worker: build: dockercoins/worker image: ${REGISTRY-127.0.0.1:5000}/worker:${TAG-latest} ... deploy: replicas: 10Just in case you were wondering ... Docker "services" are not Kubernetes "services".
Avoiding the latest tag
Make sure that you've set the TAG variable properly!
If you don't, the tag will default to
latestThe problem with
latest: nobody knows what it points to!the latest commit in the repo?
the latest commit in some branch? (Which one?)
the latest tag?
some random version pushed by a random team member?
If you keep pushing the
latesttag, how do you roll back?Image tags should be meaningful, i.e. correspond to code branches, tags, or hashes
Catching up
If you have problems deploying the registry ...
Or building or pushing the images ...
Don't worry: you can easily use pre-built images from the Docker Hub!
The images are named
dockercoins/worker:v0.1,dockercoins/rng:v0.1, etc.To use them, just set the
REGISTRYenvironment variable todockercoins:export REGISTRY=dockercoinsMake sure to set the
TAGtov0.1(our repositories on the Docker Hub do not provide a
latesttag)

Running our application on Kubernetes
(automatically generated title slide)
Running our application on Kubernetes
- We can now deploy our code (as well as a redis instance)
Deploy
redis:kubectl create deployment redis --image=redisDeploy everything else:
for SERVICE in hasher rng webui worker; dokubectl create deployment $SERVICE --image=$REGISTRY/$SERVICE:$TAGdone
Is this working?
After waiting for the deployment to complete, let's look at the logs!
(Hint: use
kubectl get deploy -wto watch deployment events)
- Look at some logs:kubectl logs deploy/rngkubectl logs deploy/worker
Is this working?
After waiting for the deployment to complete, let's look at the logs!
(Hint: use
kubectl get deploy -wto watch deployment events)
- Look at some logs:kubectl logs deploy/rngkubectl logs deploy/worker
🤔 rng is fine ... But not worker.
Is this working?
After waiting for the deployment to complete, let's look at the logs!
(Hint: use
kubectl get deploy -wto watch deployment events)
- Look at some logs:kubectl logs deploy/rngkubectl logs deploy/worker
🤔 rng is fine ... But not worker.
💡 Oh right! We forgot to expose.
Connecting containers together
Three deployments need to be reachable by others:
hasher,redis,rngworkerdoesn't need to be exposedwebuiwill be dealt with later
- Expose each deployment, specifying the right port:kubectl expose deployment redis --port 6379kubectl expose deployment rng --port 80kubectl expose deployment hasher --port 80
Is this working yet?
- The
workerhas an infinite loop, that retries 10 seconds after an error
Stream the worker's logs:
kubectl logs deploy/worker --follow(Give it about 10 seconds to recover)
Is this working yet?
- The
workerhas an infinite loop, that retries 10 seconds after an error
Stream the worker's logs:
kubectl logs deploy/worker --follow(Give it about 10 seconds to recover)
We should now see the worker, well, working happily.
Exposing services for external access
Now we would like to access the Web UI
We will expose it with a
NodePort(just like we did for the registry)
Create a
NodePortservice for the Web UI:kubectl expose deploy/webui --type=NodePort --port=80Check the port that was allocated:
kubectl get svc
Accessing the web UI
- We can now connect to any node, on the allocated node port, to view the web UI
- Open the web UI in your browser (http://node-ip-address:3xxxx/)
Accessing the web UI
- We can now connect to any node, on the allocated node port, to view the web UI
- Open the web UI in your browser (http://node-ip-address:3xxxx/)
Yes, this may take a little while to update. (Narrator: it was DNS.)
Accessing the web UI
- We can now connect to any node, on the allocated node port, to view the web UI
- Open the web UI in your browser (http://node-ip-address:3xxxx/)
Yes, this may take a little while to update. (Narrator: it was DNS.)
Alright, we're back to where we started, when we were running on a single node!

The Kubernetes dashboard
(automatically generated title slide)
The Kubernetes dashboard
Kubernetes resources can also be viewed with a web dashboard
We are going to deploy that dashboard with three commands:
1) actually run the dashboard
2) bypass SSL for the dashboard
3) bypass authentication for the dashboard
The Kubernetes dashboard
Kubernetes resources can also be viewed with a web dashboard
We are going to deploy that dashboard with three commands:
1) actually run the dashboard
2) bypass SSL for the dashboard
3) bypass authentication for the dashboard
There is an additional step to make the dashboard available from outside (we'll get to that)
Yes, this will open our cluster to all kinds of shenanigans. Don't do this at home.
1) Running the dashboard
We need to create a deployment and a service for the dashboard
But also a secret, a service account, a role and a role binding
All these things can be defined in a YAML file and created with
kubectl apply -f
- Create all the dashboard resources, with the following command:kubectl apply -f ~/container.training/k8s/kubernetes-dashboard.yaml
2) Bypassing SSL for the dashboard
The Kubernetes dashboard uses HTTPS, but we don't have a certificate
Recent versions of Chrome (63 and later) and Edge will refuse to connect
(You won't even get the option to ignore a security warning!)
We could (and should!) get a certificate, e.g. with Let's Encrypt
... But for convenience, for this workshop, we'll forward HTTP to HTTPS
Do not do this at home, or even worse, at work!
Running the SSL unwrapper
We are going to run
socat, telling it to accept TCP connections and relay them over SSLThen we will expose that
socatinstance with aNodePortserviceFor convenience, these steps are neatly encapsulated into another YAML file
- Apply the convenient YAML file, and defeat SSL protection:kubectl apply -f ~/container.training/k8s/socat.yaml
All our dashboard traffic is now clear-text, including passwords!
Connecting to the dashboard
- Check which port the dashboard is on:kubectl -n kube-system get svc socat
You'll want the 3xxxx port.
- Connect to http://oneofournodes:3xxxx/
The dashboard will then ask you which authentication you want to use.
Dashboard authentication
We have three authentication options at this point:
token (associated with a role that has appropriate permissions)
kubeconfig (e.g. using the
~/.kube/configfile fromnode1)"skip" (use the dashboard "service account")
Let's use "skip": we get a bunch of warnings and don't see much
3) Bypass authentication for the dashboard
The dashboard documentation explains how to do this
We just need to load another YAML file!
Grant admin privileges to the dashboard so we can see our resources:
kubectl apply -f ~/container.training/k8s/grant-admin-to-dashboard.yamlReload the dashboard and enjoy!
By the way, we just added a backdoor to our Kubernetes cluster!
Exposing the dashboard over HTTPS
We took a shortcut by forwarding HTTP to HTTPS inside the cluster
Let's expose the dashboard over HTTPS!
The dashboard is exposed through a
ClusterIPservice (internal traffic only)We will change that into a
NodePortservice (accepting outside traffic)
- Edit the service:kubectl edit service kubernetes-dashboard
NotFound?!? Y U NO WORK?!?
Editing the kubernetes-dashboard service
- If we look at the YAML that we loaded before, we'll get a hint
Editing the kubernetes-dashboard service
If we look at the YAML that we loaded before, we'll get a hint
The dashboard was created in the
kube-systemnamespace
Editing the kubernetes-dashboard service
If we look at the YAML that we loaded before, we'll get a hint
The dashboard was created in the
kube-systemnamespace
Edit the service:
kubectl -n kube-system edit service kubernetes-dashboardChange type
type:fromClusterIPtoNodePort, save, and exit
Check the port that was assigned with
kubectl -n kube-system get servicesConnect to https://oneofournodes:3xxxx/ (yes, https)
Running the Kubernetes dashboard securely
The steps that we just showed you are for educational purposes only!
If you do that on your production cluster, people can and will abuse it
For an in-depth discussion about securing the dashboard,
check this excellent post on Heptio's blog

Security implications of kubectl apply
(automatically generated title slide)
Security implications of kubectl apply
When we do
kubectl apply -f <URL>, we create arbitrary resourcesResources can be evil; imagine a
deploymentthat ...
Security implications of kubectl apply
When we do
kubectl apply -f <URL>, we create arbitrary resourcesResources can be evil; imagine a
deploymentthat ...- starts bitcoin miners on the whole cluster
Security implications of kubectl apply
When we do
kubectl apply -f <URL>, we create arbitrary resourcesResources can be evil; imagine a
deploymentthat ...starts bitcoin miners on the whole cluster
hides in a non-default namespace
Security implications of kubectl apply
When we do
kubectl apply -f <URL>, we create arbitrary resourcesResources can be evil; imagine a
deploymentthat ...starts bitcoin miners on the whole cluster
hides in a non-default namespace
bind-mounts our nodes' filesystem
Security implications of kubectl apply
When we do
kubectl apply -f <URL>, we create arbitrary resourcesResources can be evil; imagine a
deploymentthat ...starts bitcoin miners on the whole cluster
hides in a non-default namespace
bind-mounts our nodes' filesystem
inserts SSH keys in the root account (on the node)
encrypts our data and ransoms it
☠️☠️☠️
kubectl apply is the new curl | sh
curl | shis convenientIt's safe if you use HTTPS URLs from trusted sources
kubectl apply is the new curl | sh
curl | shis convenientIt's safe if you use HTTPS URLs from trusted sources
kubectl apply -fis convenientIt's safe if you use HTTPS URLs from trusted sources
Example: the official setup instructions for most pod networks
kubectl apply is the new curl | sh
curl | shis convenientIt's safe if you use HTTPS URLs from trusted sources
kubectl apply -fis convenientIt's safe if you use HTTPS URLs from trusted sources
Example: the official setup instructions for most pod networks
It introduces new failure modes (like if you try to apply yaml from a link that's no longer valid)

Scaling a deployment
(automatically generated title slide)
Scaling a deployment
- We will start with an easy one: the
workerdeployment
- Open two new terminals to check what's going on with pods and deployments:kubectl get pods -wkubectl get deployments -w
- Now, create more
workerreplicas:kubectl scale deploy/worker --replicas=10
After a few seconds, the graph in the web UI should show up.
(And peak at 10 hashes/second, just like when we were running on a single one.)

Daemon sets
(automatically generated title slide)
Daemon sets
We want to scale
rngin a way that is different from how we scaledworkerWe want one (and exactly one) instance of
rngper nodeWhat if we just scale up
deploy/rngto the number of nodes?nothing guarantees that the
rngcontainers will be distributed evenlyif we add nodes later, they will not automatically run a copy of
rngif we remove (or reboot) a node, one
rngcontainer will restart elsewhere
Instead of a
deployment, we will use adaemonset
Daemon sets in practice
Daemon sets are great for cluster-wide, per-node processes:
kube-proxyweave(our overlay network)monitoring agents
hardware management tools (e.g. SCSI/FC HBA agents)
etc.
They can also be restricted to run only on some nodes
Creating a daemon set
- Unfortunately, as of Kubernetes 1.12, the CLI cannot create daemon sets
Creating a daemon set
Unfortunately, as of Kubernetes 1.12, the CLI cannot create daemon sets
More precisely: it doesn't have a subcommand to create a daemon set
Creating a daemon set
Unfortunately, as of Kubernetes 1.12, the CLI cannot create daemon sets
More precisely: it doesn't have a subcommand to create a daemon set
But any kind of resource can always be created by providing a YAML description:
kubectl apply -f foo.yaml
Creating a daemon set
Unfortunately, as of Kubernetes 1.12, the CLI cannot create daemon sets
More precisely: it doesn't have a subcommand to create a daemon set
But any kind of resource can always be created by providing a YAML description:
kubectl apply -f foo.yaml
- How do we create the YAML file for our daemon set?
Creating a daemon set
Unfortunately, as of Kubernetes 1.12, the CLI cannot create daemon sets
More precisely: it doesn't have a subcommand to create a daemon set
But any kind of resource can always be created by providing a YAML description:
kubectl apply -f foo.yaml
How do we create the YAML file for our daemon set?
- option 1: read the docs
Creating a daemon set
Unfortunately, as of Kubernetes 1.12, the CLI cannot create daemon sets
More precisely: it doesn't have a subcommand to create a daemon set
But any kind of resource can always be created by providing a YAML description:
kubectl apply -f foo.yaml
How do we create the YAML file for our daemon set?
option 1: read the docs
option 2:
viour way out of it
Creating the YAML file for our daemon set
- Let's start with the YAML file for the current
rngresource
Dump the
rngresource in YAML:kubectl get deploy/rng -o yaml --export >rng.ymlEdit
rng.yml
Note: --export will remove "cluster-specific" information, i.e.:
- namespace (so that the resource is not tied to a specific namespace)
- status and creation timestamp (useless when creating a new resource)
- resourceVersion and uid (these would cause... interesting problems)
"Casting" a resource to another
What if we just changed the
kindfield?(It can't be that easy, right?)
- Change
kind: Deploymenttokind: DaemonSet
Save, quit
Try to create our new resource:
kubectl apply -f rng.yml
"Casting" a resource to another
What if we just changed the
kindfield?(It can't be that easy, right?)
- Change
kind: Deploymenttokind: DaemonSet
Save, quit
Try to create our new resource:
kubectl apply -f rng.yml
We all knew this couldn't be that easy, right!
Understanding the problem
- The core of the error is:error validating data:[ValidationError(DaemonSet.spec):unknown field "replicas" in io.k8s.api.extensions.v1beta1.DaemonSetSpec,...
Understanding the problem
- The core of the error is:error validating data:[ValidationError(DaemonSet.spec):unknown field "replicas" in io.k8s.api.extensions.v1beta1.DaemonSetSpec,...
- Obviously, it doesn't make sense to specify a number of replicas for a daemon set
Understanding the problem
- The core of the error is:error validating data:[ValidationError(DaemonSet.spec):unknown field "replicas" in io.k8s.api.extensions.v1beta1.DaemonSetSpec,...
Obviously, it doesn't make sense to specify a number of replicas for a daemon set
Workaround: fix the YAML
- remove the
replicasfield - remove the
strategyfield (which defines the rollout mechanism for a deployment) - remove the
progressDeadlineSecondsfield (also used by the rollout mechanism) - remove the
status: {}line at the end
- remove the
Or, we could also ...
Use the --force, Luke
We could also tell Kubernetes to ignore these errors and try anyway
The
--forceflag's actual name is--validate=false
- Try to load our YAML file and ignore errors:kubectl apply -f rng.yml --validate=false
Use the --force, Luke
We could also tell Kubernetes to ignore these errors and try anyway
The
--forceflag's actual name is--validate=false
- Try to load our YAML file and ignore errors:kubectl apply -f rng.yml --validate=false
🎩✨🐇
Use the --force, Luke
We could also tell Kubernetes to ignore these errors and try anyway
The
--forceflag's actual name is--validate=false
- Try to load our YAML file and ignore errors:kubectl apply -f rng.yml --validate=false
🎩✨🐇
Wait ... Now, can it be that easy?
Checking what we've done
- Did we transform our
deploymentinto adaemonset?
- Look at the resources that we have now:kubectl get all
Checking what we've done
- Did we transform our
deploymentinto adaemonset?
- Look at the resources that we have now:kubectl get all
We have two resources called rng:
the deployment that was existing before
the daemon set that we just created
We also have one too many pods.
(The pod corresponding to the deployment still exists.)
deploy/rng and ds/rng
You can have different resource types with the same name
(i.e. a deployment and a daemon set both named
rng)We still have the old
rngdeploymentNAME DESIRED CURRENT UP-TO-DATE AVAILABLE AGEdeployment.apps/rng 1 1 1 1 18mBut now we have the new
rngdaemon set as wellNAME DESIRED CURRENT READY UP-TO-DATE AVAILABLE NODE SELECTOR AGEdaemonset.apps/rng 2 2 2 2 2 <none> 9s
Too many pods
If we check with
kubectl get pods, we see:one pod for the deployment (named
rng-xxxxxxxxxx-yyyyy)one pod per node for the daemon set (named
rng-zzzzz)
NAME READY STATUS RESTARTS AGErng-54f57d4d49-7pt82 1/1 Running 0 11mrng-b85tm 1/1 Running 0 25srng-hfbrr 1/1 Running 0 25s[...]
Too many pods
If we check with
kubectl get pods, we see:one pod for the deployment (named
rng-xxxxxxxxxx-yyyyy)one pod per node for the daemon set (named
rng-zzzzz)
NAME READY STATUS RESTARTS AGErng-54f57d4d49-7pt82 1/1 Running 0 11mrng-b85tm 1/1 Running 0 25srng-hfbrr 1/1 Running 0 25s[...]
The daemon set created one pod per node, except on the master node.
The master node has taints preventing pods from running there.
(To schedule a pod on this node anyway, the pod will require appropriate tolerations.)
(Off by one? We don't run these pods on the node hosting the control plane.)
What are all these pods doing?
Let's check the logs of all these
rngpodsAll these pods have the label
app=rng:- the first pod, because that's what
kubectl create deploymentdoes - the other ones (in the daemon set), because we copied the spec from the first one
- the first pod, because that's what
Therefore, we can query everybody's logs using that
app=rngselector
- Check the logs of all the pods having a label
app=rng:kubectl logs -l app=rng --tail 1
It appears that all the pods are serving requests at the moment.
The magic of selectors
The
rngservice is load balancing requests to a set of podsThis set of pods is defined as "pods having the label
app=rng"
- Check the selector in the
rngservice definition:kubectl describe service rng
When we created additional pods with this label, they were
automatically detected by svc/rng and added as endpoints
to the associated load balancer.
Removing the first pod from the load balancer
- What would happen if we removed that pod, with
kubectl delete pod ...?
Removing the first pod from the load balancer
What would happen if we removed that pod, with
kubectl delete pod ...?The
replicasetwould re-create it immediately.
Removing the first pod from the load balancer
What would happen if we removed that pod, with
kubectl delete pod ...?The
replicasetwould re-create it immediately.What would happen if we removed the
app=rnglabel from that pod?
Removing the first pod from the load balancer
What would happen if we removed that pod, with
kubectl delete pod ...?The
replicasetwould re-create it immediately.What would happen if we removed the
app=rnglabel from that pod?The
replicasetwould re-create it immediately.
Removing the first pod from the load balancer
What would happen if we removed that pod, with
kubectl delete pod ...?The
replicasetwould re-create it immediately.What would happen if we removed the
app=rnglabel from that pod?The
replicasetwould re-create it immediately.... Because what matters to the
replicasetis the number of pods matching that selector.
Removing the first pod from the load balancer
What would happen if we removed that pod, with
kubectl delete pod ...?The
replicasetwould re-create it immediately.What would happen if we removed the
app=rnglabel from that pod?The
replicasetwould re-create it immediately.... Because what matters to the
replicasetis the number of pods matching that selector.But but but ... Don't we have more than one pod with
app=rngnow?
Removing the first pod from the load balancer
What would happen if we removed that pod, with
kubectl delete pod ...?The
replicasetwould re-create it immediately.What would happen if we removed the
app=rnglabel from that pod?The
replicasetwould re-create it immediately.... Because what matters to the
replicasetis the number of pods matching that selector.But but but ... Don't we have more than one pod with
app=rngnow?The answer lies in the exact selector used by the
replicaset...
Deep dive into selectors
- Let's look at the selectors for the
rngdeployment and the associated replica set
Show detailed information about the
rngdeployment:kubectl describe deploy rngShow detailed information about the
rngreplica:
(The second command doesn't require you to get the exact name of the replica set)kubectl describe rs rng-yyyyyyyykubectl describe rs -l app=rng
The replica set selector also has a pod-template-hash, unlike the pods in our daemon set.
Updating a service through labels and selectors
(automatically generated title slide)
Updating a service through labels and selectors
What if we want to drop the
rngdeployment from the load balancer?Option 1:
- destroy it
Option 2:
add an extra label to the daemon set
update the service selector to refer to that label
Updating a service through labels and selectors
What if we want to drop the
rngdeployment from the load balancer?Option 1:
- destroy it
Option 2:
add an extra label to the daemon set
update the service selector to refer to that label
Of course, option 2 offers more learning opportunities. Right?
Add an extra label to the daemon set
We will update the daemon set "spec"
Option 1:
edit the
rng.ymlfile that we used earlierload the new definition with
kubectl apply
Option 2:
- use
kubectl edit
- use
Add an extra label to the daemon set
We will update the daemon set "spec"
Option 1:
edit the
rng.ymlfile that we used earlierload the new definition with
kubectl apply
Option 2:
- use
kubectl edit
- use
If you feel like you got this💕🌈, feel free to try directly.
We've included a few hints on the next slides for your convenience!
We've put resources in your resources
Reminder: a daemon set is a resource that creates more resources!
There is a difference between:
the label(s) of a resource (in the
metadatablock in the beginning)the selector of a resource (in the
specblock)the label(s) of the resource(s) created by the first resource (in the
templateblock)
You need to update the selector and the template (metadata labels are not mandatory)
The template must match the selector
(i.e. the resource will refuse to create resources that it will not select)
Adding our label
Let's add a label
isactive: yesIn YAML,
yesshould be quoted; i.e.isactive: "yes"
- Update the daemon set to add
isactive: "yes"to the selector and template label:kubectl edit daemonset rng
- Update the service to add
isactive: "yes"to its selector:kubectl edit service rng
Checking what we've done
- Check the most recent log line of all
app=rngpods to confirm that exactly one per node is now active:kubectl logs -l app=rng --tail 1
The timestamps should give us a hint about how many pods are currently receiving traffic.
- Look at the pods that we have right now:kubectl get pods
Cleaning up
The pods of the deployment and the "old" daemon set are still running
We are going to identify them programmatically
List the pods with
app=rngbut withoutisactive=yes:kubectl get pods -l app=rng,isactive!=yesRemove these pods:
kubectl delete pods -l app=rng,isactive!=yes
Cleaning up stale pods
$ kubectl get podsNAME READY STATUS RESTARTS AGErng-54f57d4d49-7pt82 1/1 Terminating 0 51mrng-54f57d4d49-vgz9h 1/1 Running 0 22srng-b85tm 1/1 Terminating 0 39mrng-hfbrr 1/1 Terminating 0 39mrng-vplmj 1/1 Running 0 7mrng-xbpvg 1/1 Running 0 7m[...]The extra pods (noted
Terminatingabove) are going away... But a new one (
rng-54f57d4d49-vgz9habove) was restarted immediately!
Cleaning up stale pods
$ kubectl get podsNAME READY STATUS RESTARTS AGErng-54f57d4d49-7pt82 1/1 Terminating 0 51mrng-54f57d4d49-vgz9h 1/1 Running 0 22srng-b85tm 1/1 Terminating 0 39mrng-hfbrr 1/1 Terminating 0 39mrng-vplmj 1/1 Running 0 7mrng-xbpvg 1/1 Running 0 7m[...]The extra pods (noted
Terminatingabove) are going away... But a new one (
rng-54f57d4d49-vgz9habove) was restarted immediately!Remember, the deployment still exists, and makes sure that one pod is up and running
If we delete the pod associated to the deployment, it is recreated automatically
Deleting a deployment
- Remove the
rngdeployment:kubectl delete deployment rng
Deleting a deployment
- Remove the
rngdeployment:kubectl delete deployment rng
- The pod that was created by the deployment is now being terminated:
$ kubectl get podsNAME READY STATUS RESTARTS AGErng-54f57d4d49-vgz9h 1/1 Terminating 0 4mrng-vplmj 1/1 Running 0 11mrng-xbpvg 1/1 Running 0 11m[...]Ding, dong, the deployment is dead! And the daemon set lives on.
Avoiding extra pods
When we changed the definition of the daemon set, it immediately created new pods. We had to remove the old ones manually.
How could we have avoided this?
Avoiding extra pods
When we changed the definition of the daemon set, it immediately created new pods. We had to remove the old ones manually.
How could we have avoided this?
By adding the
isactive: "yes"label to the pods before changing the daemon set!This can be done programmatically with
kubectl patch:PATCH='metadata:labels:isactive: "yes"'kubectl get pods -l app=rng -l controller-revision-hash -o name |xargs kubectl patch -p "$PATCH"
Labels and debugging
When a pod is misbehaving, we can delete it: another one will be recreated
But we can also change its labels
It will be removed from the load balancer (it won't receive traffic anymore)
Another pod will be recreated immediately
But the problematic pod is still here, and we can inspect and debug it
We can even re-add it to the rotation if necessary
(Very useful to troubleshoot intermittent and elusive bugs)
Labels and advanced rollout control
Conversely, we can add pods matching a service's selector
These pods will then receive requests and serve traffic
Examples:
one-shot pod with all debug flags enabled, to collect logs
pods created automatically, but added to rotation in a second step
(by setting their label accordingly)
This gives us building blocks for canary and blue/green deployments
Rolling updates
(automatically generated title slide)
Rolling updates
By default (without rolling updates), when a scaled resource is updated:
new pods are created
old pods are terminated
... all at the same time
if something goes wrong, ¯\_(ツ)_/¯
Rolling updates
With rolling updates, when a resource is updated, it happens progressively
Two parameters determine the pace of the rollout:
maxUnavailableandmaxSurgeThey can be specified in absolute number of pods, or percentage of the
replicascountAt any given time ...
there will always be at least
replicas-maxUnavailablepods availablethere will never be more than
replicas+maxSurgepods in totalthere will therefore be up to
maxUnavailable+maxSurgepods being updated
We have the possibility to rollback to the previous version
(if the update fails or is unsatisfactory in any way)
Checking current rollout parameters
- Recall how we build custom reports with
kubectlandjq:
- Show the rollout plan for our deployments:kubectl get deploy -o json |jq ".items[] | {name:.metadata.name} + .spec.strategy.rollingUpdate"
Rolling updates in practice
As of Kubernetes 1.8, we can do rolling updates with:
deployments,daemonsets,statefulsetsEditing one of these resources will automatically result in a rolling update
Rolling updates can be monitored with the
kubectl rolloutsubcommand
Building a new version of the worker service
Go to the
stackdirectory:cd ~/container.training/stacksEdit
dockercoins/worker/worker.py; update the firstsleepline to sleep 1 secondBuild a new tag and push it to the registry:
#export REGISTRY=localhost:3xxxxexport TAG=v0.2docker-compose -f dockercoins.yml builddocker-compose -f dockercoins.yml push
Rolling out the new worker service
- Let's monitor what's going on by opening a few terminals, and run:kubectl get pods -wkubectl get replicasets -wkubectl get deployments -w
- Update
workereither withkubectl edit, or by running:kubectl set image deploy worker worker=$REGISTRY/worker:$TAG
Rolling out the new worker service
- Let's monitor what's going on by opening a few terminals, and run:kubectl get pods -wkubectl get replicasets -wkubectl get deployments -w
- Update
workereither withkubectl edit, or by running:kubectl set image deploy worker worker=$REGISTRY/worker:$TAG
That rollout should be pretty quick. What shows in the web UI?
Give it some time
At first, it looks like nothing is happening (the graph remains at the same level)
According to
kubectl get deploy -w, thedeploymentwas updated really quicklyBut
kubectl get pods -wtells a different storyThe old
podsare still here, and they stay inTerminatingstate for a whileEventually, they are terminated; and then the graph decreases significantly
This delay is due to the fact that our worker doesn't handle signals
Kubernetes sends a "polite" shutdown request to the worker, which ignores it
After a grace period, Kubernetes gets impatient and kills the container
(The grace period is 30 seconds, but can be changed if needed)
Rolling out something invalid
- What happens if we make a mistake?
Update
workerby specifying a non-existent image:export TAG=v0.3kubectl set image deploy worker worker=$REGISTRY/worker:$TAGCheck what's going on:
kubectl rollout status deploy worker
Rolling out something invalid
- What happens if we make a mistake?
Update
workerby specifying a non-existent image:export TAG=v0.3kubectl set image deploy worker worker=$REGISTRY/worker:$TAGCheck what's going on:
kubectl rollout status deploy worker
Our rollout is stuck. However, the app is not dead.
(After a minute, it will stabilize to be 20-25% slower.)
What's going on with our rollout?
Why is our app a bit slower?
Because
MaxUnavailable=25%... So the rollout terminated 2 replicas out of 10 available
Okay, but why do we see 5 new replicas being rolled out?
Because
MaxSurge=25%... So in addition to replacing 2 replicas, the rollout is also starting 3 more
It rounded down the number of MaxUnavailable pods conservatively,
but the total number of pods being rolled out is allowed to be 25+25=50%
The nitty-gritty details
We start with 10 pods running for the
workerdeploymentCurrent settings: MaxUnavailable=25% and MaxSurge=25%
When we start the rollout:
- two replicas are taken down (as per MaxUnavailable=25%)
- two others are created (with the new version) to replace them
- three others are created (with the new version) per MaxSurge=25%)
Now we have 8 replicas up and running, and 5 being deployed
Our rollout is stuck at this point!
Checking the dashboard during the bad rollout
If you haven't deployed the Kubernetes dashboard earlier, just skip this slide.
- Check which port the dashboard is on:kubectl -n kube-system get svc socat
Note the 3xxxx port.
- Connect to http://oneofournodes:3xxxx/
Checking the dashboard during the bad rollout
If you haven't deployed the Kubernetes dashboard earlier, just skip this slide.
- Check which port the dashboard is on:kubectl -n kube-system get svc socat
Note the 3xxxx port.
- Connect to http://oneofournodes:3xxxx/
- We have failures in Deployments, Pods, and Replica Sets
Recovering from a bad rollout
We could push some
v0.3image(the pod retry logic will eventually catch it and the rollout will proceed)
Or we could invoke a manual rollback
- Cancel the deployment and wait for the dust to settle down:kubectl rollout undo deploy workerkubectl rollout status deploy worker
Changing rollout parameters
We want to:
- revert to
v0.1 - be conservative on availability (always have desired number of available workers)
- go slow on rollout speed (update only one pod at a time)
- give some time to our workers to "warm up" before starting more
- revert to
The corresponding changes can be expressed in the following YAML snippet:
spec: template: spec: containers: - name: worker image: $REGISTRY/worker:v0.1 strategy: rollingUpdate: maxUnavailable: 0 maxSurge: 1 minReadySeconds: 10Applying changes through a YAML patch
We could use
kubectl edit deployment workerBut we could also use
kubectl patchwith the exact YAML shown before
- Apply all our changes and wait for them to take effect:kubectl patch deployment worker -p "spec:template:spec:containers:- name: workerimage: $REGISTRY/worker:v0.1strategy:rollingUpdate:maxUnavailable: 0maxSurge: 1minReadySeconds: 10"kubectl rollout status deployment workerkubectl get deploy -o json worker |jq "{name:.metadata.name} + .spec.strategy.rollingUpdate"
Accessing logs from the CLI
(automatically generated title slide)
Accessing logs from the CLI
The
kubectl logscommands has limitations:it cannot stream logs from multiple pods at a time
when showing logs from multiple pods, it mixes them all together
We are going to see how to do it better
Doing it manually
We could (if we were so inclined), write a program or script that would:
take a selector as an argument
enumerate all pods matching that selector (with
kubectl get -l ...)fork one
kubectl logs --follow ...command per containerannotate the logs (the output of each
kubectl logs ...process) with their originpreserve ordering by using
kubectl logs --timestamps ...and merge the output
We could do it, but thankfully, others did it for us already!
Stern
Stern is an open source project by Wercker.
From the README:
Stern allows you to tail multiple pods on Kubernetes and multiple containers within the pod. Each result is color coded for quicker debugging.
The query is a regular expression so the pod name can easily be filtered and you don't need to specify the exact id (for instance omitting the deployment id). If a pod is deleted it gets removed from tail and if a new pod is added it automatically gets tailed.
Exactly what we need!
Installing Stern
Run
stern(without arguments) to check if it's installed:$ sternTail multiple pods and containers from KubernetesUsage:stern pod-query [flags]If it is not installed, the easiest method is to download a binary release
The following commands will install Stern on a Linux Intel 64 bit machine:
sudo curl -L -o /usr/local/bin/stern \https://github.com/wercker/stern/releases/download/1.10.0/stern_linux_amd64sudo chmod +x /usr/local/bin/stern
Using Stern
There are two ways to specify the pods for which we want to see the logs:
-lfollowed by a selector expression (like with manykubectlcommands)with a "pod query", i.e. a regex used to match pod names
These two ways can be combined if necessary
- View the logs for all the rng containers:stern rng
Stern convenient options
The
--tail Nflag shows the lastNlines for each container(Instead of showing the logs since the creation of the container)
The
-t/--timestampsflag shows timestampsThe
--all-namespacesflag is self-explanatory
- View what's up with the
weavesystem containers:stern --tail 1 --timestamps --all-namespaces weave
Using Stern with a selector
When specifying a selector, we can omit the value for a label
This will match all objects having that label (regardless of the value)
Everything created with
kubectl runhas a labelrunWe can use that property to view the logs of all the pods created with
kubectl runSimilarly, everything created with
kubectl create deploymenthas a labelapp
- View the logs for all the things started with
kubectl create deployment:stern -l app
Managing stacks with Helm
(automatically generated title slide)
Managing stacks with Helm
We created our first resources with
kubectl run,kubectl expose...We have also created resources by loading YAML files with
kubectl apply -fFor larger stacks, managing thousands of lines of YAML is unreasonable
These YAML bundles need to be customized with variable parameters
(E.g.: number of replicas, image version to use ...)
It would be nice to have an organized, versioned collection of bundles
It would be nice to be able to upgrade/rollback these bundles carefully
Helm is an open source project offering all these things!
Helm concepts
helmis a CLI tooltilleris its companion server-side componentA "chart" is an archive containing templatized YAML bundles
Charts are versioned
Charts can be stored on private or public repositories
Installing Helm
- If the
helmCLI is not installed in your environment, install it
Check if
helmis installed:helmIf it's not installed, run the following command:
curl https://raw.githubusercontent.com/kubernetes/helm/master/scripts/get | bash
Installing Tiller
Tiller is composed of a service and a deployment in the
kube-systemnamespaceThey can be managed (installed, upgraded...) with the
helmCLI
- Deploy Tiller:helm init
If Tiller was already installed, don't worry: this won't break it.
At the end of the install process, you will see:
Happy Helming!Fix account permissions
Helm permission model requires us to tweak permissions
In a more realistic deployment, you might create per-user or per-team service accounts, roles, and role bindings
- Grant
cluster-adminrole tokube-system:defaultservice account:kubectl create clusterrolebinding add-on-cluster-admin \--clusterrole=cluster-admin --serviceaccount=kube-system:default
(Defining the exact roles and permissions on your cluster requires a deeper knowledge of Kubernetes' RBAC model. The command above is fine for personal and development clusters.)
View available charts
A public repo is pre-configured when installing Helm
We can view available charts with
helm search(and an optional keyword)
View all available charts:
helm searchView charts related to
prometheus:helm search prometheus
Install a chart
Most charts use
LoadBalancerservice types by defaultMost charts require persistent volumes to store data
We need to relax these requirements a bit
- Install the Prometheus metrics collector on our cluster:helm install stable/prometheus \--set server.service.type=NodePort \--set server.persistentVolume.enabled=false
Where do these --set options come from?
Inspecting a chart
helm inspectshows details about a chart (including available options)
- See the metadata and all available options for
stable/prometheus:helm inspect stable/prometheus
The chart's metadata includes an URL to the project's home page.
(Sometimes it conveniently points to the documentation for the chart.)
Creating a chart
We are going to show a way to create a very simplified chart
In a real chart, lots of things would be templatized
(Resource names, service types, number of replicas...)
Create a sample chart:
helm create dockercoinsMove away the sample templates and create an empty template directory:
mv dockercoins/templates dockercoins/default-templatesmkdir dockercoins/templates
Exporting the YAML for our application
- The following section assumes that DockerCoins is currently running
- Create one YAML file for each resource that we need:while read kind name; dokubectl get -o yaml --export $kind $name > dockercoins/templates/$name-$kind.yamldone <<EOFdeployment workerdeployment hasherdaemonset rngdeployment webuideployment redisservice hasherservice rngservice webuiservice redisEOF
Testing our helm chart
- Let's install our helm chart! (
dockercoinsis the path to the chart)helm install dockercoins
Testing our helm chart
- Let's install our helm chart! (
dockercoinsis the path to the chart)helm install dockercoins
Since the application is already deployed, this will fail:
Error: release loitering-otter failed: services "hasher" already existsTo avoid naming conflicts, we will deploy the application in another namespace
Namespaces
(automatically generated title slide)
Namespaces
We cannot have two resources with the same name
(Or can we...?)
Namespaces
We cannot have two resources with the same name
(Or can we...?)
We cannot have two resources of the same type with the same name
(But it's OK to have a
rngservice, arngdeployment, and arngdaemon set!)
Namespaces
We cannot have two resources with the same name
(Or can we...?)
We cannot have two resources of the same type with the same name
(But it's OK to have a
rngservice, arngdeployment, and arngdaemon set!)We cannot have two resources of the same type with the same name in the same namespace
(But it's OK to have e.g. two
rngservices in different namespaces!)
Namespaces
We cannot have two resources with the same name
(Or can we...?)
We cannot have two resources of the same type with the same name
(But it's OK to have a
rngservice, arngdeployment, and arngdaemon set!)We cannot have two resources of the same type with the same name in the same namespace
(But it's OK to have e.g. two
rngservices in different namespaces!)In other words: the tuple (type, name, namespace) needs to be unique
(In the resource YAML, the type is called
Kind)
Pre-existing namespaces
If we deploy a cluster with
kubeadm, we have three namespaces:default(for our applications)kube-system(for the control plane)kube-public(contains one secret used for cluster discovery)
If we deploy differently, we may have different namespaces
Creating namespaces
Creating a namespace is done with the
kubectl create namespacecommand:kubectl create namespace blueWe can also get fancy and use a very minimal YAML snippet, e.g.:
kubectl apply -f- <<EOFapiVersion: v1kind: Namespacemetadata:name: blueEOFThe two methods above are identical
If we are using a tool like Helm, it will create namespaces automatically
Using namespaces
We can pass a
-nor--namespaceflag to mostkubectlcommands:kubectl -n blue get svcWe can also change our current context
A context is a (user, cluster, namespace) tuple
We can manipulate contexts with the
kubectl configcommand
Viewing existing contexts
- On our training environments, at this point, there should be only one context
- View existing contexts to see the cluster name and the current user:kubectl config get-contexts
The current context (the only one!) is tagged with a
*What are NAME, CLUSTER, AUTHINFO, and NAMESPACE?
What's in a context
NAME is an arbitrary string to identify the context
CLUSTER is a reference to a cluster
(i.e. API endpoint URL, and optional certificate)
AUTHINFO is a reference to the authentication information to use
(i.e. a TLS client certificate, token, or otherwise)
NAMESPACE is the namespace
(empty string =
default)
Switching contexts
We want to use a different namespace
Solution 1: update the current context
This is appropriate if we need to change just one thing (e.g. namespace or authentication).
Solution 2: create a new context and switch to it
This is appropriate if we need to change multiple things and switch back and forth.
Let's go with solution 1!
Updating a context
This is done through
kubectl config set-contextWe can update a context by passing its name, or the current context with
--current
Update the current context to use the
bluenamespace:kubectl config set-context --current --namespace=blueCheck the result:
kubectl config get-contexts
Using our new namespace
- Let's check that we are in our new namespace, then deploy the DockerCoins chart
Verify that the new context is empty:
kubectl get allDeploy DockerCoins:
helm install dockercoins
In the last command line, dockercoins is just the local path where
we created our Helm chart before.
Viewing the deployed app
- Let's see if our Helm chart worked correctly!
Retrieve the port number allocated to the
webuiservice:kubectl get svc webuiPoint our browser to http://X.X.X.X:3xxxx
Note: it might take a minute or two for the app to be up and running.
Namespaces and isolation
Namespaces do not provide isolation
A pod in the
greennamespace can communicate with a pod in thebluenamespaceA pod in the
defaultnamespace can communicate with a pod in thekube-systemnamespaceCoreDNS uses a different subdomain for each namespace
Example: from any pod in the cluster, you can connect to the Kubernetes API with:
https://kubernetes.default.svc.cluster.local:443/
Isolating pods
Actual isolation is implemented with network policies
Network policies are resources (like deployments, services, namespaces...)
Network policies specify which flows are allowed:
between pods
from pods to the outside world
and vice-versa
Switch back to the default namespace
- Let's make sure that we don't run future exercises in the
bluenamespace
- Switch back to the original context:kubectl config set-context --current --namespace=
Note: we could have used --namespace=default for the same result.
Switching namespaces more easily
We can also use a little helper tool called
kubens:# Switch to namespace fookubens foo# Switch back to the previous namespacekubens -On our clusters,
kubensis calledknsinstead(so that it's even fewer keystrokes to switch namespaces)
kubens and kubectx
With
kubens, we can switch quickly between namespacesWith
kubectx, we can switch quickly between contextsBoth tools are simple shell scripts available from https://github.com/ahmetb/kubectx
On our clusters, they are installed as
knsandkctx(for brevity and to avoid completion clashes between
kubectxandkubectl)
kube-ps1
It's easy to lose track of our current cluster / context / namespace
kube-ps1makes it easy to track these, by showing them in our shell promptIt's a simple shell script available from https://github.com/jonmosco/kube-ps1
On our clusters,
kube-ps1is installed and included inPS1:[123.45.67.89] (kubernetes-admin@kubernetes:default) docker@node1 ~(The highlighted part is
context:namespace, managed bykube-ps1)Highly recommended if you work across multiple contexts or namespaces!
Next steps
(automatically generated title slide)
Next steps
Alright, how do I get started and containerize my apps?
Next steps
Alright, how do I get started and containerize my apps?
Suggested containerization checklist:
- write a Dockerfile for one service in one app
- write Dockerfiles for the other (buildable) services
- write a Compose file for that whole app
- make sure that devs are empowered to run the app in containers
- set up automated builds of container images from the code repo
- set up a CI pipeline using these container images
- set up a CD pipeline (for staging/QA) using these images
And then it is time to look at orchestration!
Options for our first production cluster
Get a managed cluster from a major cloud provider (AKS, EKS, GKE...)
(price: $, difficulty: medium)
Hire someone to deploy it for us
(price: $$, difficulty: easy)
Do it ourselves
(price: $-$$$, difficulty: hard)
One big cluster vs. multiple small ones
Yes, it is possible to have prod+dev in a single cluster
(and implement good isolation and security with RBAC, network policies...)
But it is not a good idea to do that for our first deployment
Start with a production cluster + at least a test cluster
Implement and check RBAC and isolation on the test cluster
(e.g. deploy multiple test versions side-by-side)
Make sure that all our devs have usable dev clusters
(whether it's a local minikube or a full-blown multi-node cluster)
Namespaces
Namespaces let you run multiple identical stacks side by side
Two namespaces (e.g.
blueandgreen) can each have their ownredisserviceEach of the two
redisservices has its ownClusterIPCoreDNS creates two entries, mapping to these two
ClusterIPaddresses:redis.blue.svc.cluster.localandredis.green.svc.cluster.localPods in the
bluenamespace get a search suffix ofblue.svc.cluster.localAs a result, resolving
redisfrom a pod in thebluenamespace yields the "local"redis
This does not provide isolation! That would be the job of network policies.
Relevant sections
-
(covers permissions model, user and service accounts management ...)
Stateful services (databases etc.)
As a first step, it is wiser to keep stateful services outside of the cluster
Exposing them to pods can be done with multiple solutions:
ExternalNameservices
(redis.blue.svc.cluster.localwill be aCNAMErecord)ClusterIPservices with explicitEndpoints
(instead of letting Kubernetes generate the endpoints from a selector)Ambassador services
(application-level proxies that can provide credentials injection and more)
Stateful services (second take)
If we want to host stateful services on Kubernetes, we can use:
a storage provider
persistent volumes, persistent volume claims
stateful sets
Good questions to ask:
what's the operational cost of running this service ourselves?
what do we gain by deploying this stateful service on Kubernetes?
Relevant sections: Volumes | Stateful Sets | Persistent Volumes
HTTP traffic handling
Services are layer 4 constructs
HTTP is a layer 7 protocol
It is handled by ingresses (a different resource kind)
Ingresses allow:
- virtual host routing
- session stickiness
- URI mapping
- and much more!
This section shows how to expose multiple HTTP apps using Træfik
Logging
Logging is delegated to the container engine
Logs are exposed through the API
Logs are also accessible through local files (
/var/log/containers)Log shipping to a central platform is usually done through these files
(e.g. with an agent bind-mounting the log directory)
This section shows how to do that with Fluentd and the EFK stack
Metrics
The kubelet embeds cAdvisor, which exposes container metrics
(cAdvisor might be separated in the future for more flexibility)
It is a good idea to start with Prometheus
(even if you end up using something else)
Starting from Kubernetes 1.8, we can use the Metrics API
Heapster was a popular add-on
(but is being deprecated starting with Kubernetes 1.11)
Managing the configuration of our applications
Two constructs are particularly useful: secrets and config maps
They allow to expose arbitrary information to our containers
Avoid storing configuration in container images
(There are some exceptions to that rule, but it's generally a Bad Idea)
Never store sensitive information in container images
(It's the container equivalent of the password on a post-it note on your screen)
This section shows how to manage app config with config maps (among others)
Managing stack deployments
The best deployment tool will vary, depending on:
- the size and complexity of your stack(s)
- how often you change it (i.e. add/remove components)
- the size and skills of your team
A few examples:
Cluster federation
Cluster federation

Cluster federation
Sorry Star Trek fans, this is not the federation you're looking for!
Cluster federation
Sorry Star Trek fans, this is not the federation you're looking for!
(If I add "Your cluster is in another federation" I might get a 3rd fandom wincing!)
Cluster federation
Kubernetes master operation relies on etcd
etcd uses the Raft protocol
Raft recommends low latency between nodes
What if our cluster spreads to multiple regions?
Cluster federation
Kubernetes master operation relies on etcd
etcd uses the Raft protocol
Raft recommends low latency between nodes
What if our cluster spreads to multiple regions?
Break it down in local clusters
Regroup them in a cluster federation
Synchronize resources across clusters
Discover resources across clusters
Developer experience
We've put this last, but it's pretty important!
How do you on-board a new developer?
What do they need to install to get a dev stack?
How does a code change make it from dev to prod?
How does someone add a component to a stack?
Links and resources
(automatically generated title slide)
Links and resources
Kubernetes Community - Slack, Google Groups, meetups
These slides (and future updates) are on → http://container.training/